Harris Teeter 2003 Annual Report Download - page 2
Download and view the complete annual report
Please find page 2 of the 2003 Harris Teeter annual report below. You can navigate through the pages in the report by either clicking on the pages listed below, or by using the keyword search tool below to find specific information within the annual report.-
 1
1 -
 2
2 -
 3
3 -
 4
4 -
 5
5 -
 6
6 -
 7
7 -
 8
8 -
 9
9 -
 10
10 -
 11
11 -
 12
12 -
 13
13 -
14
 |
 |

Corporate Address
301 S.Tryon St.
Suite 1800
Charlotte, NC 28202
704-372-5404
Subsidiaries
Harris Teeter, Inc.
701 Crestdale Drive
Matthews, NC 28105
704-844-3100
American & Efird, Inc.
P.O. Box 507
Mount Holly, NC 28120
704-827-4311
General Counsel
Helms Mulliss & Wicker, PLLC
Charlotte, NC
Independent Public Accountants
KPMG LLP
Charlotte, NC
New York Stock Exchange Listing
Common shares symbol: RDK
Stock Transfer Agent and Registrar
Wachovia Bank, N.A.
Charlotte, NC
Shareholders/Shares Outstanding
As of September 28, 2003, Ruddick had
approximately 13,600 beneficial common
shareholders (including employee/owners) and
approximately 46.2 million shares outstanding.
Dividends
It has been Ruddick’s practice to pay approximately 30% of
net income in dividends. Regular quarterly dividends are
usually paid at the first of January, April, July and October.
Dividend Reinvestment and
Stock Purchase Plan
Ruddick Corporation maintains a Dividend Reinvestment
and Stock Purchase Plan for shareholders of record.
Information on this plan may be obtained by calling
Ruddick Corporation at 704-372-5404.
Employee Stock Ownership Plan
Ruddick has an Employee Stock Ownership Plan (ESOP),
which was established in 1976. At fiscal year end,
approximately 18% of Ruddick’s common shares were
owned by associates as participants in the ESOP.
Annual Meeting
The Annual Meeting of the Shareholders of Ruddick
Corporation will be held in the Auditorium, 12th Floor,
Two Wachovia Center, 301 S.Tryon Street, Charlotte, NC,
on February 19, 2004 at 10:00 a.m. Shareholders are
cordially invited to attend.
Annual Reports Including Form 10-K
Additional copies of the Company’s Form 10-K are available
without charge upon written request or by telephone.
Written requests may be directed to the Investor Relations
Department, Ruddick Corporation, 301 S.Tryon St.,
Suite 1800, Charlotte, NC 28202. Telephone inquiries may
be directed to 704-372-5404.
Design: Perry Sessions Design, Inc. / Charlotte, NC Writing: Strategic Equity Marketing / Charlotte, NC
RUDDICK CORPORATION & SUBSIDIARIES ANNUAL REPORT TWO THOUSAND THREE
1 The historical Net Sales and Operating Profit for fiscal 1996 and prior represent continuing operations, and do not include the
Sales and Operating Profit of Jordan Graphics Inc. which was discontinued in fiscal 1996.
2 Operating Profit, Net Income, Net Income Per Share - Diluted and related returns include the following exit and impairment
charges and tax settlement, which are more fully described in the Company’s annual report on Form 10-K:
Fiscal 2003: Exit and impairment charges at A&E of $580,000 ($360,000 after taxes, or $0.01 per diluted share).
Fiscal 2002: Exit and impairment credits at Harris Teeter of $710,000 ($431,000 after taxes, or $0.01 per diluted share)
and exit and impairment charges at A&E of $7,823,000 ($4,825,000 after taxes, or $0.10 per diluted share).
Fiscal 2001: Exit and impairment charges at Harris Teeter of $45,035,000 ($27,370,000 after taxes, or $0.59 per diluted
share), exit and impairment charges at A&E of $2,105,000 ($1,285,000 after taxes, or $0.03 per diluted share)
and a tax settlement with the IRS for $20,000,000 ($0.43 per diluted share).
3 53-week year.
4 Includes purchase of assets of Threads USA.
SHAREHOLDER INFORMATIONELEVEN-YEAR FINANCIAL AND OPERATING SUMMARY
(dollars in thousands, except share and per share data) 2003220022200122000 199931998 1997 1996 1995 1994 19933
Net Sales1
Harris Teeter $ 2,431,632 $ 2,349,650 $ 2,416,799 $ 2,332,908 $ 2,273,156 $ 2,132,223 $ 1,931,212 $ 1,833,042 $ 1,711,813 $ 1,578,880 $ 1,412,315
American & Efird 293,107 294,548 326,491 359,183 361,133 365,184 378,723 317,261 307,391 287,643 273,909
Total Net Sales $ 2,724,739 $ 2,644,198 $ 2,743,290 $ 2,692,091 $ 2,634,289 $ 2,497,407 $ 2,309,935 $ 2,150,303 $ 2,019,204 $ 1,866,523 $ 1,686,224
Operating Profit (Loss)1
Harris Teeter $ 93,622 $ 88,773 $ 31,802 $ 59,146 $ 55,438 $ 52,126 $ 45,671 $ 48,459 $ 42,114 $ 37,032 $ 29,845
American & Efird 13,624 12,495 21,635 47,478 48,617 42,070 49,165 34,684 34,614 26,916 30,551
Corporate (5,134) (7,466) (4,735) (7,178) (7,507) (7,770) (9,794) (10,109) (8,126) (5,666) (5,331)
Total Operating Profit $ 102,112 $ 93,802 $ 48,702 $ 99,446 $ 96,548 $ 86,426 $ 85,042 $ 73,034 $ 68,602 $ 58,282 $ 55,065
Net Income (Loss) $ 59,882 $ 51,983 $ (727) $ 51,002 $ 50,714 $ 46,772 $ 47,731 $ 42,802 $ 39,267 $ 31,811 $ 33,873
Net Income (Loss) Per Share — Diluted 1.29 1.12 (0.02) 1.10 1.08 1.00 1.02 0.92 0.84 0.67 0.71
Common Dividend 0.36 0.36 0.36 0.36 0.33 0.32 0.32 0.26 0.25 0.22 0.21
Shareholders’ Equity $ 495,265 $ 457,688 $ 445,353 $ 473,005 $ 443,683 $ 410,725 $ 380,507 $ 346,856 $ 316,236 $ 291,209 $ 274,740
Percent Return on Beginning Equity 13.1% 11.7% (0.2%) 11.5% 12.3% 12.3% 13.8% 13.5% 13.5% 11.6% 13.3%
Book Value Per Share $ 10.71 $ 9.85 $ 9.61 $ 10.23 $ 9.55 $ 8.82 $ 8.17 $ 7.47 $ 6.82 $ 6.28 $ 5.87
Capital Expenditures
Harris Teeter $ 64,370 $ 66,591 $ 68,525 $ 98,973 $ 77,513 $ 75,082 $ 86,237 $ 83,204 $ 81,447 $ 46,349 $ 33,683
American & Efird 9,197 7,833 19,169 19,744 15,658 20,246 28,878 35,605416,359 20,416 19,433
Corporate 14 4,692 27 38 3,766 145 184 4,471 399 35 27
Total Capital Expenditures $ 73,581 $ 79,116 $ 87,721 $ 118,755 $ 96,937 $ 95,473 $ 115,299 $ 123,280 $ 98,205 $ 66,800 $ 53,143
Working Capital $ 161,621 $ 165,911 $ 112,272 $ 138,091 $ 124,060 $ 87,333 $ 88,893 $ 65,134 $ 73,741 $ 93,387 $ 103,191
Total Assets 1,067,203 1,038,947 939,988 1,021,018 970,114 931,618 885,243 801,702 715,318 634,599 580,807
Long-Term Debt — Including Current Portion 189,095 185,892 157,113 227,940 198,961 191,931 190,494 164,435 128,952 109,567 104,173
Long-Term Debt as a Percent of Capital Employed 27.3% 28.5% 25.7% 32.1% 30.7% 31.6% 33.1% 32.2% 29.0% 27.3% 27.5%
Number of Employees 17,500 17,650 17,100 20,000 19,800 20,700 19,700 20,100 19,850 18,610 17,120
Number of Beneficial Shareholders
Including Employee/Owners 13,600 15,400 15,000 16,000 19,500 21,000 19,100 16,700 14,500 14,100 14,600
Common Shares Outstanding 46,223,233 46,454,188 46,319,696 46,220,876 46,451,240 46,554,591 46,599,301 46,461,290 46,373,666 46,352,214 46,036,146
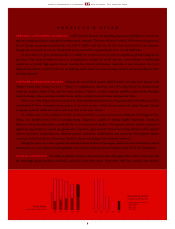
99 00 01 02
Closing Stock Price
Fiscal Year End
IN DOLLARS
16.19
13.88
15.30
15.40
03
15.79