Harris Teeter 2002 Annual Report Download - page 2
Download and view the complete annual report
Please find page 2 of the 2002 Harris Teeter annual report below. You can navigate through the pages in the report by either clicking on the pages listed below, or by using the keyword search tool below to find specific information within the annual report.-
 1
1 -
 2
2 -
 3
3 -
 4
4 -
 5
5 -
 6
6 -
 7
7 -
 8
8 -
 9
9 -
 10
10 -
 11
11 -
 12
12 -
 13
13 -
14
-
15
-
16
-
17
-
18
 |
 |

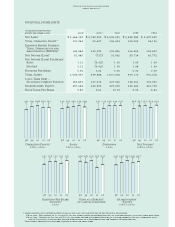
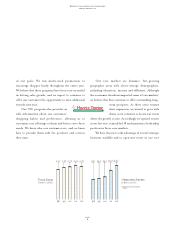
Operating Profit 1
In Millions of Dollars
Sales
In Billions of Dollars
Dividends
In Dollars
Net Income 1
In Millions of Dollars
Shareholders'
Equity
In Millions of Dollars
Earnings Per Share
Diluted 1
In Dollars
Debt as a Percent
of Capital Employed
99 00 01 02
94.2 104.1 106.6 100.6 101.3
99 00 01 02
2.50 2.63 2.69 2.74 2.64
99 00 01 02
0.32 0.33 0.36 0.36 0.36
98 99989898 00 01 02
46.8 50.7 51.0 47.9 52.0
98 99 00 01 02
1.00 1.08 1.10 1.03 1.12
98 99 00 01 02
31.60 30.70 32.10 25.70 28.50
98 99 00 01 02
410.7 443.7 473.0 445.4 457.7
Ruddick Corporation and Subsidiaries
annual report 2002
1The following non-recurring items in fiscal 2002 and 2001 are included in the financial highlights:
Fiscal 2002: Net charges of $7,113,000 ($4,394,000 after income tax benefit) related to asset impairment costs and other exit costs.
Fiscal 2001: Charges of $47,140,000 ($28,655,000 after income tax benefit) related to asset impairment costs and other exit costs
and of $20,000,000 of additional income taxes related to a settlement with the Internal Revenue Service.
The graphic presentation has been adjusted to exclude these items.
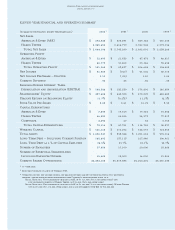
FINANCIAL HIGHLIGHTS
(dollars in thousands,
except per share data) 20021200112000 1999 1998
Net Sales $ 2,644,198 $ 2,743,290 $ 2,692,091 $ 2,634,289 $ 2,497,407
Total Operating Profit 1101,268 53,437 106,624 104,055 94,196
Earnings Before Interest,
Taxes, Depreciation and
Amortization (EBITDA) 1168,588 125,230 176,896 166,699 152,851
Net Income (Loss) 151,983 (727) 51,002 50,714 46,772
Net Income (Loss) Per Share 1
Basic 1.12 (0.02) 1.10 1.09 1.00
Diluted 1.12 (0.02) 1.10 1.08 1.00
Dividend Per Share 0.36 0.36 0.36 0.33 0.32
Total Assets 1,038,947 939,988 1,021,018 970,114 931,618
Long-Term Debt —
Including Current Portion 185,892 157,113 227,940 198,961 191,931
Shareholders’ Equity 457,688 445,353 473,005 443,683 410,725
Book Value Per Share 9.85 9.61 10.23 9.55 8.82