Harman Kardon 2012 Annual Report Download - page 5
Download and view the complete annual report
Please find page 5 of the 2012 Harman Kardon annual report below. You can navigate through the pages in the report by either clicking on the pages listed below, or by using the keyword search tool below to find specific information within the annual report.-
 1
1 -
 2
2 -
 3
3 -
 4
4 -
 5
5 -
 6
6
 |
 |

remains a differentiating HARMAN strength,
and we have built a robust talent bench with
which to seize future opportunities.
We continue to reach out to the communities where
we live and work through a variety of educational
and sponsorship programs focused on our passion
for education, music and the arts. We delivered on a
key environmental stewardship target by achieving
a five percent reduction in energy use and green-
house gas emissions at several key facilities during
the second half of the fiscal year, and we are
extending this program and its proven principles
to HARMAN facilities worldwide.
Beyond our steadily improving financial perform-
ance, we took several additional steps to increase
shareholder value during fiscal year 2012 – doubling
our annual dividend and launching a $200 million
share repurchase program. Two major ratings
agencies upgraded Harman’s outlook midway through
the fiscal year, and both Standard and Poor’s and
Moody’s have raised the Company’s corporate credit
rating to investment grade as this report goes
to press.
I am very proud of HARMAN’s management team
and the thousands of talented employees world-
wide who have embraced our culture of continuous
improvement. Our team is energized to carry this
performance into fiscal year 2013, and we look
forward to the continued support of our customers,
employees, and shareholders toward cementing
HARMAN’s position as the clear global leader in
audio and infotainment.
Best regards,
Dinesh C. Paliwal
Chairman, President and
Chief Executive Officer
talent PERFORMANCE
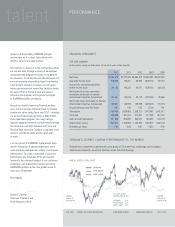
HARMAN’S JOURNEY: COMPANY PERFORMANCE VS. THE MARKET
Harman has consistently outperformed a peer group of 28 automotive, technology, and consumer
electronics companies, as well as the Dow Jones Industrial Average.
HAR VS. PEERS / DOW JONES
FEB. 2008 SEPT. 2012WORST OF GLOBAL RECESSION EUROZONE CRISIS I EUROZONE CRISIS II
2/6/2008
HAR 38.70
PEERS 57.97
9/28/2012
HAR 46.16
PEERS 44.96
TSR, FEB. 6, 2008,
ENDING SEP. 30, 2012
HARMAN 21%
PEER GROUP -31%
DOW JONES 10%
HARMAN
PEER GROUP
DOW JONES
FINANCIAL HIGHLIGHTS
FIVE YEAR SUMMARY
(In thousands, except per share data, for the fiscal years ended June 30)
2012 2011 2010 2009 2008
Net sales $4,364,078 $3,772,345 $3,364,428 $2,854,895 $4,072,359
Operating income (loss) 300,246 190,051 85,555 (503,812) 132,167
Income from continuing operations
before income taxes 261,153 160,220 49,077 (528,610) 109,209
Net income (loss) from continuing
operations attributable to Harman
International Industries, Incorporated 329,541 135,916 35,178 (422,345) 95,966
Net income (loss) attributable to Harman
International Industries, Incorporated 329,541 135,916 158,769 (431,504) 101,723
Diluted Earnings (Loss) Per Share 4.57 1.90 2.25 (7.34) 1.64
Total assets 3,169,464 3,058,495 2,556,215 2,473,497 2,802,971
Total debt 395,688 381,014 377,837 577,296 361,737
Cash and cash equivalents 617,356 603,892 645,570 586,359 223,109
Shareholders’ equity 1,529,611 1,423,658 1,134,892 1,007,918 1,382,108
Dividends per share 0.30 0.05 0.00 0.025 0.05