Halliburton 2009 Annual Report Download - page 5
Download and view the complete annual report
Please find page 5 of the 2009 Halliburton annual report below. You can navigate through the pages in the report by either clicking on the pages listed below, or by using the keyword search tool below to find specific information within the annual report.-
 1
1 -
 2
2 -
 3
3 -
 4
4 -
 5
5 -
 6
6 -
 7
7 -
 8
8 -
 9
9 -
 10
10 -
 11
11 -
 12
12 -
 13
13 -
 14
14 -
 15
15 -
 16
16 -
17
-
18
-
19
-
20
-
21
-
22
-
23
-
24
-
25
-
26
-
27
-
28
-
29
-
30
-
31
-
32
-
33
-
34
-
35
-
36
-
37
-
38
-
39
-
40
-
41
-
42
-
43
-
44
-
45
-
46
-
47
-
48
-
49
-
50
-
51
-
52
-
53
-
54
-
55
-
56
-
57
-
58
-
59
-
60
-
61
-
62
-
63
-
64
-
65
-
66
-
67
-
68
-
69
-
70
-
71
-
72
-
73
-
74
-
75
-
76
-
77
-
78
-
79
-
80
-
81
-
82
-
83
-
84
-
85
-
86
-
87
-
88
-
89
-
90
-
91
-
92
-
93
-
94
-
95
-
96
-
97
-
98
-
99
-
100
-
101
-
102
-
103
-
104
-
105
-
106
-
107
-
108
-
109
-
110
-
111
-
112
-
113
-
114
-
115
-
116
-
117
-
118
-
119
-
120
-
121
-
122
 |
 |

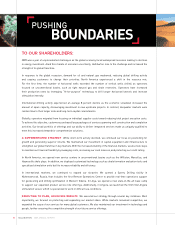
PUSHING BOUNDARIES 01
in millions in millions
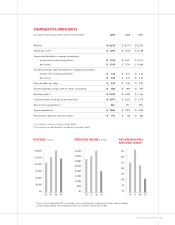
(MILLIONS OF DOLLARS AND SHARES, EXCEPT PER SHARE DATA) 2008 2007
Revenue $ 18,279 $ 15,264
Operating income $ 4,010 $ 3,498
Amounts attributable to company shareholders:
Income from continuing operations $ 2,647 $ 2,511
Net income $ 2,224 $ 3,486
Diluted income per share attributable to company shareholders:
Income from continuing operations $ 2.91 $ 2.63
Net income $ 2.45 $ 3.65
Cash dividends per share $ 0.36 $ 0.35
Diluted weighted average common shares outstanding $ 909 $ 955
Working capital (1) $ 4,630 $ 5,162
Long-term debt (including current maturities) $ 2,612 $ 2,779
Debt to total capitalization (2) 25% 29%
Capital expenditures $ 1,824 $ 1,583
Depreciation, depletion, and amortization $ 738 $ 583
(1) Calculated as current assets minus current liabilities
(2) Calculated as total debt divided by total debt plus shareholders’ equity
$18,000
$15,000
$12,000
$9,000
$6,000
$3,000
$0
$4,000
$3,500
$3,000
$2,500
$2,000
$1,500
$1,000
$500
$0
35%
30%
25%
20%
15%
10%
5%
0%
06 06 0609 09 0908 08 0807 07 07
*Return on capital employed (ROCE) is calculated as net income attributable to company before interest expense divided by
average capital employed. Capital employed includes total shareholders’ equity and total debt.