HR Block 2010 Annual Report Download - page 5
Download and view the complete annual report
Please find page 5 of the 2010 HR Block annual report below. You can navigate through the pages in the report by either clicking on the pages listed below, or by using the keyword search tool below to find specific information within the annual report.-
 1
1 -
 2
2 -
 3
3 -
 4
4 -
 5
5 -
 6
6 -
 7
7 -
 8
8 -
 9
9 -
 10
10 -
 11
11 -
 12
12 -
 13
13 -
 14
14 -
 15
15 -
 16
16 -
17
-
18
-
19
-
20
-
21
-
22
-
23
-
24
-
25
-
26
-
27
-
28
-
29
-
30
-
31
-
32
-
33
-
34
-
35
-
36
-
37
-
38
-
39
-
40
-
41
-
42
-
43
-
44
-
45
-
46
-
47
-
48
-
49
-
50
-
51
-
52
-
53
-
54
-
55
-
56
-
57
-
58
-
59
-
60
-
61
-
62
-
63
-
64
-
65
-
66
-
67
-
68
-
69
-
70
-
71
-
72
-
73
-
74
-
75
-
76
-
77
-
78
-
79
-
80
-
81
-
82
-
83
-
84
-
85
-
86
-
87
-
88
-
89
-
90
-
91
-
92
-
93
-
94
-
95
-
96
-
97
-
98
-
99
-
100
 |
 |

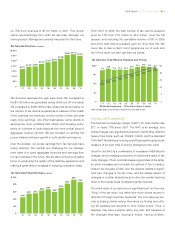
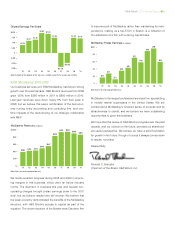
up 75% from revenues of $1.701 billion in 2001. This growth
came overwhelmingly from retail tax services, although our
online product offerings are certainly important for the future.
0
500
1,000
1,500
2,000
2,500
3,000
$
3,500
’01 ’02 ’03 ’04 ’10’09’08’07’06’05
$1,701
$1,910 $1,947
$2,191
$2,975
$3,132
$3,061
$2,686
$2,450
$2,357
Tax Services Revenue
(in millions)
Tax Services revenues this year were down 5% compared to
the $3.132 billion we generated during 2009, but off only about
3% compared to 2008. While many observers focus heavily on
the number of tax returns prepared as a measure of the health
of the business, tax revenues, not the number of units, are what
really drive earnings. Like other businesses, some clients or
services are more profitable than others, and focusing exclu-
sively on numbers of units obscures the more critical issue of
aggregate revenue growth. We are focused on striking the
proper balance between growth in both clients and revenue.
Over the decade, our pretax earnings from Tax Services have
nearly doubled. The number one challenge for our manage-
ment team is to grow aggregate revenues and earnings from
our tax business in the future. We are also continuing a healthy
focus on enhancing the quality of the retail tax experience and
making a great deal of progress in reducing excessive costs.
’01 ’02 ’03 ’04 ’10’09’08’07’06’05
$440
$541 $557
$638
$867
$927
$826
$705
$590
$665
Tax Services Pretax Earnings (in millions)
0
200
400
600
800
$1,000
From 2001 to 2008, the total number of tax returns prepared
grew by 13% from 21.8 million to 24.6 million. Over the full
decade, and including the cumulative decline of 6% in 2009
and 2010, total returns prepared grew by more than 6%. We
never like to lose a client, but if people are out of work and
don’t file a return we can’t get them as clients.
0
50
100
150
$200
0
5
10
15
20
25
’01 ’02 ’03 ’04 ’10’09’08’07’06’05
21.8 22.9 22.0 22.3 23.2
23.9
24.6
24.0
22.9
22.0
$112 $121 $130
Retail Net Average Charge
$140
$189
$187
$175
$165
$155
$147
Tax Services: Total Returns Prepared and Pricing
Tax Returns Prepared (in millions)
Note: Average charge is net of discounts, except for fiscal years prior to 2005.
Pricing and Complexity
The blended net average charge (“NAC”) for retail clients rose
$77, or nearly 70% since 2001. The NAC is an average, and
actual charges vary significantly between clients filing different
types of tax forms, such as 1040EZ, 1040A, and the standard
1040 itself. Nonetheless, lumping everything together gives some
measure of the sum total of pricing changes per tax client.
Growth in the NAC is a combination of increases in H&R Block’s
charges, and increasing complexity of returns as a result of tax
code changes. There is almost always a good deal of the latter,
so price increases are not solely the actions of the Company.
Indeed, the increase in NAC over the decade reflects in signifi-
cant part changes in the tax code, and the steady stream of
changes in credits, deductions and other tax events reaching
down to the lowest levels of adjusted gross incomes.
The client value of our service is in significant part not the mere
“filing” of the tax return, but rather how much clients recover in
refunds or through lower tax payments. The core value we pro-
vide is helping clients reduce their taxes by finding and utiliz-
ing all possible tax benefits to their fullest extent. Thus, a
taxpayer may have a simple return one year, and because of
life changes (marriage, buying a house, having children,
H&R Block 2010 Annual Report n 3