Graco 2011 Annual Report Download
Download and view the complete annual report
Please find the complete 2011 Graco annual report below. You can navigate through the pages in the report by either clicking on the pages listed below, or by using the keyword search tool below to find specific information within the annual report.-
 1
1 -
 2
2 -
 3
3 -
 4
4 -
 5
5 -
 6
6 -
 7
7 -
 8
8 -
 9
9 -
 10
10 -
 11
11 -
 12
12 -
13
-
14
-
15
-
16
-
17
-
18
-
19
-
20
-
21
-
22
-
23
-
24
-
25
-
26
-
27
-
28
-
29
-
30
-
31
-
32
-
33
-
34
-
35
-
36
-
37
-
38
-
39
-
40
-
41
-
42
-
43
-
44
-
45
-
46
-
47
-
48
-
49
-
50
-
51
-
52
-
53
-
54
-
55
-
56
-
57
-
58
-
59
-
60
-
61
-
62
-
63
-
64
-
65
-
66
-
67
-
68
-
69
-
70
-
71
-
72
-
73
-
74
-
75
-
76
-
77
-
78
-
79
-
80
-
81
-
82
-
83
-
84
-
85
-
86
-
87
 |
 |

2011 ANNUAL REPORT
SHARPENING OUR CHOICES AND
STRENGTHENING OUR GAME
FOR ACCELERATED PERFORMANCE
Table of contents
-
Page 1
2011 ANNUAL REPORT SHARPENING OUR CHOICES AND STRENGTHENING OUR GAME FOR ACCELERATED PERFORMANCE -
Page 2
NEWELL RUBBERMAID IS MAKING SHARPER CHOICES AND STRENGTHENING CAPABILITIES FOR ACCELERATED PERFORMANCE. -
Page 3
... chapter of the Newell Rubbermaid story. Our new Growth Game Plan is the strategy we are implementing to fulï¬ll our ambition to build a bigger, faster-growing, more global and more proï¬table company. Michael B. Polk President and Chief Executive Ofï¬cer NEWELL RUBBERMAID 2011 Annual Report 1 -
Page 4
...฀in฀ our฀quarterly฀dividend฀and฀the฀repurchase฀of฀3.4฀million฀shares. In฀addition฀to฀our฀financial฀performance,฀the฀business฀accomplished฀a฀number฀of฀milestones฀that฀will฀ help lay the foundation for future growth Completed฀the฀implementation... -
Page 5
...day, where they live, learn, work and play CT&A, iP&s, LABELinG, COMMERCiAL PROduCTs FinE WRiTinG WRiTinG & CREATiVE EXPREssiOn HOME ORGAniZATiOn & sTYLE CuLinARY LiFEsTYLEs HARdWARE BABY & PAREnTinG EndiCiA, MiMiO RuBBERMAid MEdiCAL sOLuTiOns BusinEss MOdEL Our Consumer brands win at the point of... -
Page 6
... to our Growth Game Plan or their passion to drive increased performance going forward. We have a clear path to build a bigger, faster-growing, more global and more profitable company. Sincerely, Michael B. Polk President and Chief Executive Ofï¬cer 4 NEWELL RUBBERMAID 2011 Annual Report -
Page 7
...end-users฀get฀the฀job฀done฀ right. Our professional-facing global business units include฀Commercial฀Products;฀Construction฀Tools฀ &฀Accessories;฀Labeling฀Technology฀&฀Integrated฀ Solutions;฀and฀Industrial฀Products฀&฀Services. NEWELL RUBBERMAID 2011 Annual... -
Page 8
WE ARE TAKING NEWELL RUBBERMAID TO THE NEXT LEVEL. HERE'S HOW. 6 NEWELL RUBBERMAID 2011 Annual Report -
Page 9
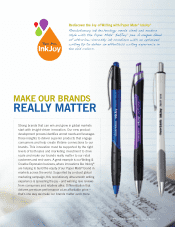
...฀must฀be฀supported฀by฀the฀right฀ levels฀of฀both฀sales฀and฀marketing฀investment฀to฀drive฀ scale and make our brands really matter to our retail customers฀and฀end-users.฀A฀great฀example฀is฀our฀Writing฀&฀ Creative฀Expression฀business,฀where... -
Page 10
...customer฀development฀organization฀-฀investing฀in฀the฀technology฀and฀ infrastructure฀to฀develop฀joint฀business฀planning฀processes฀and฀better฀collaborate฀with฀our฀ retail customers to grow our categories and gain market share. 8 NEWELL RUBBERMAID 2011 Annual... -
Page 11
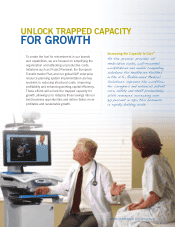
... for healthcare facilities in the U.S., Rubbermaid Medical Solutions improves the workflow for caregivers and enhances patient care, safety and staff productivity. With revenues increasing over 80 percent in 2011, this business is rapidly building scale. NEWELL RUBBERMAID 2011 Annual Report 9 -
Page 12
... key to driving success. Achieving best-in-class results requires a best-in-class organization. At Newell Rubbermaid we are building a performance culture in alignment with our evolving business strategy. Two key priorities are enhancing our international perspective and developing the capabilities... -
Page 13
...15฀percent฀of฀our฀net฀sales,฀is฀ growing at double-digit annual rates. We are taking a strategic and disciplined approach to global expansion฀to฀ensure฀profitable฀and฀sustainable฀growth.฀Our฀top฀two฀focus฀areas฀are฀Latin฀America฀and฀ China,฀where฀we... -
Page 14
...Figuereo, Chief Financial Ofï¬cer; Bill Burke, President, Newell Professional Group; Michael Polk, President and Chief Executive Ofï¬cer; and Penny McIntyre, President, Newell Consumer Group discuss the opportunities to leverage the Company's growth agenda. 12 NEWELL RUBBERMAID 2011 Annual Report -
Page 15
...products and innovation, more completely deploy our portfolio across our existing geographic footprint, and aggressively expand into the faster-growing emerging markets. We're building a more focused, stronger and nimbler organization for sustained, proï¬table growth. NEWELL RUBBERMAID 2011 Annual... -
Page 16
... share of the investment focused outside North America, but there will be signiï¬cant investments in North America as well, including, for example, strengthening our e-commerce capabilities. Q A Mike, you're working directly with the Baby & Parenting business to strengthen its performance... -
Page 17
... In North America, where we enjoy considerable market strength already, we are doubling down support for our Rubbermaid Consumer cleaning platform and for our culinary business, Calphalon®, which had a phenomenal year in 2011. Q A How does Newell Rubbermaid's ï¬nancial performance and structure... -
Page 18
... Financial Ofï¬cer Executive Vice President, Chief Human Resource Ofï¬cer THEODORE W. WOEHRLE G. PENNY MCINTYRE President, Newell Consumer Group Senior Vice President, Chief Marketing Ofï¬cer J. EDUARDO SENF President, Newell Rubbermaid International 16 NEWELL RUBBERMAID 2011 Annual Report -
Page 19
... Statements of Stockholders' Equity and Comprehensive Income 48 Notes to Consolidated Financial Statements 83 Common Stock Price Performance Graph 84 Market for Common Equity and Related Stockholder Matters 84 Reconciliation of Non-GAAP Financial Measures NEWELL RUBBERMAID 2011 Annual Report... -
Page 20
... been derived in part from, and should be read in conjunction with, the Consolidated Financial Statements of the Company included elsewhere in this report and the schedules thereto. 2011(1) STATEMENTS OF OPERATIONS DATA Net sales Cost of products sold Gross margin Selling, general and administrative... -
Page 21
... repayment of Aprica's outstanding debt obligations at closing. Aprica is a Japanese brand of premium strollers, car seats and other related juvenile products. The acquisition provides the opportunity for the Company's Baby & Parenting business to broaden its presence worldwide, including expanding... -
Page 22
... to meet consumers' needs. The GBU structure positions the business units to leverage research and development, branding, marketing and innovation on a global basis and facilitates the Company's objective of optimizing working capital and shared resources. 20 NEWELL RUBBERMAID 2011 Annual Report -
Page 23
...-time install, stay-in-car Smart Base™ that accommodates newborns all the way up to children weighing 100 pounds; - Expansion of the Aprica® product line in Japan with car seats and strollers with features to enhance comfort, convenience and maneuverability; NEWELL RUBBERMAID 2011 Annual Report... -
Page 24
... the Waterman® Pure White™ collection; - Expansion of sales forces in the Technology and Industrial Products & Services GBUs to drive greater sales penetration and enhance the availability of products; - Rubbermaid® Commercial Products HYGEN Clean Water System, which is a revolutionary mopping... -
Page 25
... the Company's operations. The following table sets forth items from the Consolidated Statements of Operations as reported and as a percentage of net sales for the year ended December 31, (in millions, except percentages): 2011 2010 2009 Net sales Cost of products sold Gross margin Selling, general... -
Page 26
...year driven by growth in the Company's international businesses, particularly in emerging markets, with double-digit core sales growth in the Latin America and Asia Pacific regions, across substantially all segments. Excluding foreign currency, sales at the Company's international and North American... -
Page 27
... associated with the Capital Structure Optimization Plan, the Company recognized lower income tax expense and a lower effective tax rate in 2010 compared to 2009. See Footnote 16 of the Notes to Consolidated Financial Statements for further information. NEWELL RUBBERMAID 2011 Annual Report 25 -
Page 28
... Financial Statements and Related Information BUSINESS SEGMENT OPERATING RESULTS 2011 vs. 2010 Business Segment Operating Results Net sales by segment were as follows for the years ended December 31, (in millions, except percentages): 2011 Home & Family Office Products Tools, Hardware & Commercial... -
Page 29
2011 Financial Statements and Related Information Tools, Hardware & Commercial Products Net sales for 2011 were $1,695.3 million, an increase of $124.4 million, or 7.9%, from $1,570.9 million for 2010. Core sales increased 6.0%. Double-digit cores sales growth in the Industrial Products & Services ... -
Page 30
2011 Financial Statements and Related Information Tools, Hardware & Commercial Products Net sales for 2010 were $1,570.9 million, an increase of $139.4 million, or 9.7%, from $1,431.5 million for 2009. Core sales increases accounted for 8.3% of the year-over-year increase, as geographic expansion ... -
Page 31
... offset by an inventory build-up in late 2011 in advance of the SAP go-live in the European region planned for the first half of 2012 and increased safety stocks in North America related to the planned closure of the Greenville, Texas manufacturing facility. NEWELL RUBBERMAID 2011 Annual Report 29 -
Page 32
2011 Financial Statements and Related Information Financial Position The Company is committed to maintaining a strong financial position through maintaining sufficient levels of available liquidity, managing working capital, and monitoring the Company's overall capitalization Cash฀and฀cash฀... -
Page 33
...repurchase its own shares of common stock through a combination of a 10b5-1 automatic trading plan, discretionary market purchases or in privately negotiated transactions. The SRP is authorized to run for a period of three years ending in August 2014. During 2011, the Company repurchased 3.4 million... -
Page 34
... and medical. See Footnote 20 of the Notes to Consolidated Financial Statements for further information. As of December 31, 2011, the Company did not have any significant off-balance sheet arrangements, as defined in Item 303(a)(4)(ii) of SEC Regulation S-K. 32 NEWELL RUBBERMAID 2011 Annual Report -
Page 35
...accounted for approximately 70 percent of the Company's total goodwill. These five reporting units were as follows: Baby & Parenting; Rubbermaid Commercial Products; Industrial Products & Services; Markers, Highlighters, Art & Office Organization; and Technology. The Company conducts its annual test... -
Page 36
...reasonable risk-adjusted return an investor would expect to realize on an investment in the reporting unit. In using the discounted cash flow approach to value the Baby & Parenting and Hardware reporting units in 2011, the Company generally used average compound long-term sales growth rates of 2% to... -
Page 37
... charge as the difference between the fair value and the carrying value of the asset group. Generally, the Company performs its testing of the asset group at the product-line level, as this is the lowest level for which identifiable cash flows are available. NEWELL RUBBERMAID 2011 Annual Report 35 -
Page 38
... anticipated future long-term performance of individual asset classes. The Company's analysis gives consideration to historical returns and long-term, prospective rates of return. •฀฀ M ฀ ortality rates: Mortality rates are based on actual and projected plan experience. •฀฀ R ฀ ate... -
Page 39
... benefit obligations in the Consolidated Statement of Operations for the year ended December 31, (in millions): 2011 Net pension cost Net postretirement beneï¬t costs Total $ 19.5 8.4 $ 27.9 2010 $ 21.5 2009 $ 18.1 8.7 $ 26.8 9.2 $ 30.7 The Company used weighted-average discount rates... -
Page 40
... Notes to Consolidated Financial Statements, Description of Business and Significant Accounting Policies-Recent Accounting Pronouncements. INTERNATIONAL OPERATIONS For 2011, 2010 and 2009, the Company's non-U.S. businesses accounted for approximately 33%, 32% and 31% of net sales, respectively (see... -
Page 41
... hedges. Gains and losses related to qualifying forward exchange contracts and cross-currency hedges, which are generally used to hedge intercompany loans and net investments in foreign subsidiaries, are recognized in other comprehensive income (loss). NEWELL RUBBERMAID 2011 Annual Report 39 -
Page 42
... of programs, including periodic raw material purchases, purchases of raw materials for future delivery and customer price adjustments help the Company address this risk. Where practical, the Company uses derivatives as part of its risk management process. Financial Instruments In managing the... -
Page 43
2011 Financial Statements and Related Information MANAGEMENT'S RESPONSIBILITY FOR FINANCIAL STATEMENTS AND ANNUAL REPORT ON INTERNAL CONTROL OVER FINANCIAL REPORTING The management of Newell Rubbermaid Inc. is responsible for the accuracy and internal consistency of the consolidated financial ... -
Page 44
... Statements and Related Information REPORT OF INDEPENDENT REGISTERED PUBLIC ACCOUNTING FIRM The Board of Directors and Stockholders of Newell Rubbermaid Inc. We have audited the accompanying consolidated balance sheets of Newell Rubbermaid Inc. and subsidiaries as of December 31, 2011 and 2010... -
Page 45
..., based on the COSO criteria. We also have audited, in accordance with the standards of the Public Company Accounting Oversight Board (United States), the consolidated balance sheets of Newell Rubbermaid Inc. and subsidiaries as of December 31, 2011 and 2010, and the related consolidated statements... -
Page 46
... per share data) Year Ended December 31, Net sales Cost of products sold Gross margin Selling, general and administrative expenses Impairment charges Restructuring costs Operating income Nonoperating expenses: Interest expense, net of interest income of $2.2, $3.5 and $6.3 in 2011, 2010 and 2009... -
Page 47
...00 par value Outstanding shares, before treasury: 2011 - 305.3 2010 - 307.2 Treasury stock, at cost: Shares held: 2011 - 17.0 2010 - 16.7 Additional paid-in capital Retained earnings Accumulated other comprehensive loss Stockholders' Equity Attributable to Parent Stockholders' Equity Attributable to... -
Page 48
... Company's common stock, which issuance is not included in the Consolidated Statements of Cash Flows for 2011 and 2010. See Footnote 9 of the Notes to Consolidated Financial Statements for further information. See Notes to Consolidated Financial Statements. 46 NEWELL RUBBERMAID 2011 Annual Report -
Page 49
2011 Financial Statements and Related Information CONSOLIDATED STATEMENTS OF STOCKHOLDERS' EQUITY AND COMPREHENSIVE INCOME (Amounts in millions) Common Stock Treasury Stock Additional Paid-In Capital Retained Earnings Accumulated Other Comprehensive Loss Stockholders' Equity Attributable to Parent ... -
Page 50
...multiproduct offering consists of well-known, name-brand consumer and commercial products in three business segments: Home & Family; Office Products; and Tools, Hardware & Commercial Products. Principles of Consolidation The Consolidated Financial Statements include the accounts of the Company, its... -
Page 51
... using earnings multiples include the projected financial performance of the reporting unit and the applicable earnings multiple. Estimates critical to the Company's fair value estimates under the discounted cash flow model include the discount rate, projected average revenue growth, projected long... -
Page 52
... accrued liabilities in the Consolidated Balance Sheets based on the maturity of the Company's forward contracts at December 31, 2011 and 2010. The earnings impact of cash flow hedges relating to forecasted purchases of inventory is generally reported in cost of products sold to match the underlying... -
Page 53
..., which is generally three to five years for stock options and one to three years for restricted stock units and performance-based restricted stock units. The Company estimates future forfeiture rates based on its historical experience. See Footnote 15 for additional information. Recent Accounting... -
Page 54
...run for a period of three years ending in August 2014. During 2011, the Company repurchased 3.4 million shares pursuant to the SRP for $46.1 million, and such shares were immediately retired. During 2010, the Company executed a series of transactions pursuant to a Capital Structure Optimization Plan... -
Page 55
... 31, 2011 Balance $ 9.6 2.8 0.5 2.8 $15.7 Segment Home & Family Office Products Tools, Hardware & Commercial Products Corporate Provision $10.6 4.4 0.8 15.4 $31.2 Costs Incurred $ (1.0) (1.6) (0.3) (12.6) $(15.5) European Transformation Plan In June 2010, the Company announced a program to... -
Page 56
... for 2010 and 2009, respectively. The impaired assets include vacated land and buildings, land and buildings for which a plan exists to vacate and dispose of the facility, and machinery and equipment to be sold or otherwise disposed of prior to the end of its original estimated useful life. The... -
Page 57
... by reportable business segment for the years ended December 31, (in millions): Since Inception Through December 31, 2010 $144.8 186.9 88.4 78.3 $498.4 Segment Home & Family Ofï¬ce Products Tools, Hardware & Commercial Products Corporate 2011 $- - - - $- 2010 $13.7 24.2 9.4 30.1 $77.4 2009 $ 24... -
Page 58
....5 December 31, 2009 Balance $ 648.7 1,149.5 956.1 $2,754.3 December 31, 2011 Balance (2) $ 360.9 1,137.5 867.6 $2,366.0 December 31, 2010 Balance (2) $ 662.6 1,135.7 951.2 $2,749.5 Segment Home & Family Office Products Tools, Hardware & Commercial Products Acquisitions $- 2.2 - $2.2 Impairment... -
Page 59
... its annual impairment tests, principally related to goodwill impairments in the Company's Baby & Parenting and Hardware global business units. The impairments generally resulted from declines in sales projections relative to previous estimates due to economic and market factors based in large part... -
Page 60
2011 Financial Statements and Related Information Customer accruals are promotional allowances and rebates, including cooperative advertising, given to customers in exchange for their selling efforts and volume purchased. The self-insurance accrual is primarily casualty liabilities such as workers'... -
Page 61
2011 Financial Statements and Related Information The medium-term note balances at December 31, 2011 and 2010 include mark-to-market adjustments of $35.8 million and $42.3 million, respectively, to record the fair value of the hedges of the fixed-rate debt, and the mark-to-market adjustments had ... -
Page 62
...$87.2 million upon the settlement of the Exchange Offer, which is included in losses related to extinguishments of debt in the Consolidated Statement of Operations for 2010. In March 2011, the Company completed exchanges of newly issued shares of common stock and cash for an additional $20.0 million... -
Page 63
... Balance Sheets on a gross basis and does not net asset and liability derivative positions with the same counterparty. The Company monitors its positions with, and the credit quality of, the financial institutions that are parties to its financial transactions. NEWELL RUBBERMAID 2011 Annual Report... -
Page 64
...as hedging instruments Interest rate swaps Foreign exchange contracts on inventory-related purchases Foreign exchange contracts on intercompany borrowings Total assets Balance Sheet Location Other assets Assets 2011 $35.8 2010 $42.3 Balance Sheet Location Other noncurrent liabilities Liabilities... -
Page 65
... exchange contracts on inventory-related purchases Foreign exchange contracts on intercompany borrowings Location of gain (loss) recognized in income Cost of products sold Interest expense, net The Company did not realize any ineffectiveness related to cash flow hedges during 2011, 2010 and 2009... -
Page 66
... Information FOOTNOTE 13 EMPLOYEE BENEFIT AND RETIREMENT PLANS The Company and its subsidiaries have noncontributory pension, profit sharing and contributory 401(k) plans covering substantially all of their international and domestic employees. Plan benefits are generally based on years of service... -
Page 67
2011 Financial Statements and Related Information Defined Benefit Pension Plans The following provides a reconciliation of benefit obligations, plan assets and funded status of the Company's noncontributory defined benefit pension plans, including the SERP, as of December 31, (in millions, except ... -
Page 68
... Weighted-average assumptions used to determine net periodic benefit cost: Discount rate Long-term rate of return on plan assets Long-term rate of compensation increase 2010 2009 2011 $ $ 2009 4.8 52.1 (57.2) 1.3 8.3 - 9.3 $ $ 2011 6.0 26.6 (28.3) 3.4 0.9 (0.8) 7.8 International 2010 $ 4.8 26.6 (24... -
Page 69
... in these separately managed accounts are primarily publicly-traded securities, and such investments have been valued using the quoted price as of December 31, 2011. Accordingly, these investments have been classified as Level 1 as of December 31, 2011. NEWELL RUBBERMAID 2011 Annual Report 67 -
Page 70
... shares or units held as of the measurement date. The investments in fixed income securities include both actively managed funds and index funds. (3) The fair values of insurance contracts are estimated based on the future cash flows to be received under the contracts discounted to the present using... -
Page 71
... appropriateness. The weighted-average expected long-term rates of return are based on reviews of the target investment allocation and the historical and expected rates of return of the asset classes included in the pension plans' target asset allocations. NEWELL RUBBERMAID 2011 Annual Report 69 -
Page 72
2011 Financial Statements and Related Information Other Postretirement Benefit Plans Several of the Company's subsidiaries currently provide retiree health care and life insurance benefits for certain employee groups. The following provides a reconciliation of benefit obligations and funded status ... -
Page 73
... would be increased by 8.3 million shares for all years presented. (2) Dilutive securities include "in the money" options, non-participating restricted stock units and performance stock units. The weighted-average shares outstanding for 2011, 2010 and 2009 exclude the effect of approximately 12... -
Page 74
2011 Financial Statements and Related Information FOOTNOTE 15 STOCK-BASED COMPENSATION The Company offers stock-based compensation to its employees that includes stock options and time-based and performance-based restricted stock units, as follows: Stock Options The Company has issued both ... -
Page 75
... of stock option awards granted was estimated using the Black-Scholes option pricing model with the following weighted-average assumptions for the years ended December 31,: 2011 Risk-free interest rate Dividend yield Expected volatility Expected life (in years) 2.6% 1.3% 39% 6.4 2010 2.9% 1.4% 38... -
Page 76
... 2011, 2010 and 2009, respectively. During 2011, 2010 and 2009, the Company awarded 0.5 million, 0.9 million and 1.2 million performance-based restricted stock units, respectively, which entitle recipients to shares of the Company's stock at the end of a three-year vesting period if specified market... -
Page 77
... tax benefits, including interest and penalties, due to the expiration of various worldwide statutes of limitation. The effective tax rate for the year ended December 31, 2011 was also favorably impacted by a change in the geographical mix in earnings. NEWELL RUBBERMAID 2011 Annual Report 75 -
Page 78
2011 Financial Statements and Related Information During 2010, the Company settled its 2005 and 2006 U.S. federal income tax return examinations, including all issues that were at the IRS Appeals Office, and as part of this settlement, entered into binding closing agreements relating to specific ... -
Page 79
... and included in cash and cash equivalents are not publicly traded, but the fair value is determined based on the values of the underlying investments in the money market fund (Level 2). The Company generally uses derivatives for hedging purposes pursuant to the relevant authoritative guidance... -
Page 80
... 31, 2011 and 2010, respectively). For mutual funds that are publicly traded, fair value is determined on the basis of quoted market prices and, accordingly, these investments have been classified as Level 1. Other investment securities are valued at the net asset value per share or unit multiplied... -
Page 81
... systems, material handling solutions and medical and computer carts, and wall-mounted work stations Office Products Tools, Hardware & Commercial Products The Company's segment and geographic results are as follows as of and for the years ended December 31, (in millions): 2011 Net Sales (1) Home... -
Page 82
2011 Financial Statements and Related Information Geographic Area Information 2011 Net Sales United States Canada Total North America Europe, Middle East and Africa Latin America Asia Paciï¬c Total International Operating Income (Loss) (2) (7) United States Canada Total North America Europe, ... -
Page 83
... Financial Statements and Related Information The following table summarizes the net sales by product grouping for the years ended December 31, (in millions): 2011 Home & Family Rubbermaid Consumer Baby & Parenting Décor Other Office Products (1) Tools, Hardware & Commercial Products (1) (1) 2010... -
Page 84
... groups will be primarily consumer-facing ("Newell Consumer"), while the other will be primarily commercial-facing ("Newell Professional"). In addition, the Baby & Parenting GBU will operate as a stand-alone operating segment and will be reported separately. 82 NEWELL RUBBERMAID 2011 Annual Report -
Page 85
2011 Financial Statements and Related Information COMMON STOCK PRICE PERFORMANCE GRAPH The following common stock price performance graph compares the yearly change in the Company's cumulative total stockholder returns on its common stock during the years 2007 through 2011, with the cumulative ... -
Page 86
...Related Information MARKET FOR COMMON EQUITY AND RELATED STOCKHOLDER MATTERS The Company's common stock is listed on the New York and Chicago Stock Exchanges (symbol: NWL). As of January 31, 2012, there were 13,206 stockholders of record. The following table sets forth the high and low sales prices... -
Page 87
CORPORATE INFORMATION SHAREHOLDER INFORMATION Newell Rubbermaid is traded on the New York Stock Exchange under the symbol NWL. Additional copies of this annual report, Newell Rubbermaid's Form 10-K and proxy statement ï¬led with the Securities and Exchange Commission, dividend reinvestment plan ...