Graco 2008 Annual Report Download - page 2
Download and view the complete annual report
Please find page 2 of the 2008 Graco annual report below. You can navigate through the pages in the report by either clicking on the pages listed below, or by using the keyword search tool below to find specific information within the annual report.-
 1
1 -
 2
2 -
 3
3 -
 4
4 -
 5
5 -
 6
6 -
 7
7 -
 8
8 -
 9
9 -
 10
10 -
 11
11 -
 12
12 -
 13
13 -
14
-
15
-
16
-
17
-
18
-
19
-
20
-
21
-
22
-
23
-
24
-
25
-
26
-
27
-
28
-
29
-
30
-
31
-
32
-
33
-
34
-
35
-
36
-
37
-
38
-
39
-
40
-
41
-
42
-
43
-
44
-
45
-
46
-
47
-
48
-
49
-
50
-
51
-
52
-
53
-
54
-
55
-
56
-
57
-
58
-
59
-
60
-
61
-
62
-
63
-
64
-
65
-
66
-
67
-
68
-
69
-
70
-
71
-
72
-
73
-
74
-
75
-
76
-
77
-
78
 |
 |

n
n
n
n
n
n
n
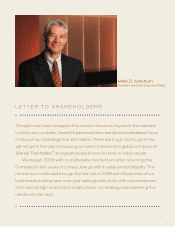
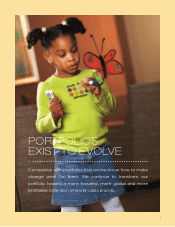
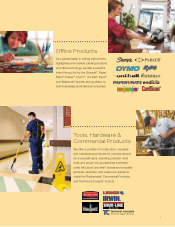
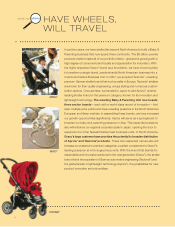
BUSINESS DESCRIPTION
Newell Rubbermaid is a global marketer of consumer and commercial products that
touch the lives of people where they work, live and play. We are committed to building
a portfolio of Brands That Matter™ while leveraging the scale of the total company to
promote operating efficiencies, shared expertise and a culture that produces best-in-class
results. Our evolution as a global company is driven by our growing understanding of
the constantly changing needs of consumers and our ability to create innovative, highly
differentiated solutions that offer great performance and value.
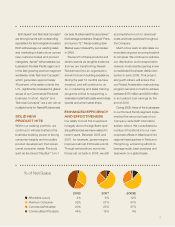
($ in millions, except per share amounts) 2008 2007 2006
Net Sales $6,471 $6,407 $6,201
Gross Margin % 32.8% 35.2% 33.4%
Operating Income(1) $620.5 $826.3 $723.0
Operating Margin(1) 9.6% 12.9% 11.7%
“Normalized” EPS(1) $ 1.22 $ 1.82 $ 1.52
(1) Please refer to the Reconciliation of Non-GAAP Financial Measures on page 73 for a reconciliation to the
most directly comparable GAAP financial measure.
FINANCIAL HIGHLIGHTS
Newell Rubbermaid Inc.
n Cleaning, Organization & Décor 33%
n Office Products 31%
n Tools & Hardware 19%
n Home & Family 17%
2
0
0
8
n US & Canada 75%
n Europe 15%
n Other 10%
Net Sales By GeographyNet Sales By Segment
BUSINESS DESCRIPTION
Newell Rubbermaid is a global marketer of consumer and commercial products that
touch the lives of people where they work, live and play. We are committed to building
a portfolio of Brands That Matter™ while leveraging the scale of the total company to
promote operating efficiencies, shared expertise and a culture that produces best-in-class
results. Our evolution as a global company is driven by our growing understanding of
the constantly changing needs of consumers and our ability to create innovative, highly
differentiated solutions that offer great performance and value.
($ in millions, except per share amounts) 2008 2007 2006
Net Sales $6,471 $6,407 $6,201
Gross Margin % 32.8% 35.2% 33.4%
Operating Income(1) $620.5 $826.3 $723.0
Operating Margin(1) 9.6% 12.9% 11.7%
“Normalized” EPS(1) $ 1.22 $ 1.82 $ 1.52
(1) Please refer to the Reconciliation of Non-GAAP Financial Measures on page 73 for a reconciliation to the
most directly comparable GAAP financial measure.
FINANCIAL HIGHLIGHTS
Newell Rubbermaid Inc.
n Cleaning, Organization & Décor 33%
n Office Products 31%
n Tools & Hardware 19%
n Home & Family 17%
2
0
0
8
n US & Canada 75%
n Europe 15%
n Other 10%
Net Sales By GeographyNet Sales By Segment