GameStop 2008 Annual Report Download - page 50
Download and view the complete annual report
Please find page 50 of the 2008 GameStop annual report below. You can navigate through the pages in the report by either clicking on the pages listed below, or by using the keyword search tool below to find specific information within the annual report.-
 1
1 -
2
-
3
-
4
-
5
-
6
-
7
-
8
-
9
-
10
-
11
-
12
-
13
-
14
-
15
-
16
-
17
-
18
-
19
-
20
-
21
-
22
-
23
-
24
-
25
-
26
-
27
-
28
-
29
-
30
-
31
-
32
-
33
-
34
-
35
-
36
-
37
-
38
-
39
-
 40
40 -
 41
41 -
 42
42 -
 43
43 -
 44
44 -
 45
45 -
 46
46 -
 47
47 -
 48
48 -
 49
49 -
 50
50 -
 51
51 -
 52
52 -
 53
53 -
 54
54 -
 55
55 -
 56
56 -
 57
57 -
 58
58 -
 59
59 -
 60
60 -
61
-
62
-
63
-
64
-
65
-
66
-
67
-
68
-
69
-
70
-
71
-
72
-
73
-
74
-
75
-
76
-
77
-
78
-
79
-
80
-
81
-
82
-
83
-
84
-
85
-
86
-
87
-
88
-
89
-
90
-
91
-
92
-
93
-
94
-
95
-
96
-
97
-
98
-
99
-
100
-
101
-
102
-
103
-
104
-
105
-
106
-
107
-
108
-
109
-
110
-
111
-
112
-
113
-
114
 |
 |

As we have expanded our presence in international markets, the Company has increased its operations in
foreign currencies, including the euro, Australian dollar, New Zealand dollar, Canadian dollar, British pound, Swiss
franc, Danish kroner, Swedish krona, and the Norwegian kroner. The notes issued in connection with the acquisition
of Micromania and the EB merger are reflected in the United States segment. See Note 20 of “Notes to Consolidated
Financial Statements” for more information.
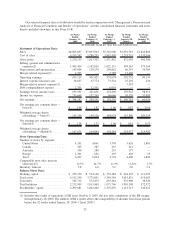
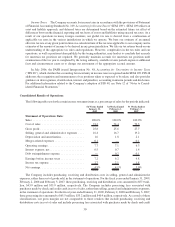
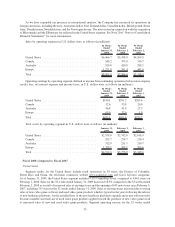
Sales by operating segment in U.S. dollars were as follows (in millions):
52 Weeks
Ended
January 31,
2009
52 Weeks
Ended
February 2,
2008
53 Weeks
Ended
February 3,
2007
United States .................................... $6,466.7 $5,438.8 $4,269.5
Canada......................................... 548.2 473.0 319.7
Australia ....................................... 520.0 420.8 288.1
Europe ......................................... 1,271.0 761.4 441.6
Total .......................................... $8,805.9 $7,094.0 $5,318.9
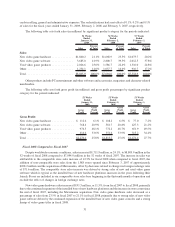
Operating earnings by operating segment, defined as income from continuing operations before intercompany
royalty fees, net interest expense and income taxes, in U.S. dollars were as follows (in millions):
52 Weeks
Ended
January 31,
2009
52 Weeks
Ended
February 2,
2008
53 Weeks
Ended
February 3,
2007
United States .................................... $530.1 $391.2 $285.4
Canada......................................... 32.6 35.8 20.0
Australia ....................................... 46.8 41.8 27.3
Europe ......................................... 65.6 32.6 1.0
Total .......................................... $675.1 $501.4 $333.7
Total assets by operating segment in U.S. dollars were as follows (in millions):
January 31,
2009
February 2,
2008
February 3,
2007
United States .................................... $2,578.0 $2,742.0 $2,618.9
Canada......................................... 293.7 274.7 210.4
Australia ....................................... 312.8 251.1 210.7
Europe ......................................... 1,328.1 508.1 309.6
Total .......................................... $4,512.6 $3,775.9 $3,349.6
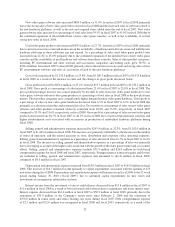
Fiscal 2008 Compared to Fiscal 2007
United States
Segment results for the United States include retail operations in 50 states, the District of Columbia,
Puerto Rico and Guam, the electronic commerce website www.gamestop.com and Game Informer magazine.
As of January 31, 2009, the United States segment included 4,331 GameStop stores, compared to 4,061 stores on
February 2, 2008. Sales for the 52 weeks ended January 31, 2009 increased 18.9% compared to the 52 weeks ended
February 2, 2008 as a result of increased sales at existing stores and the opening of 643 new stores since February 3,
2007, including 315 stores in the 52 weeks ended January 31, 2009. Sales at existing stores increased due to strong
sales of new video game software and used video game products which is typical in the years following the release
of new hardware platforms. As the installed base of the new hardware platforms expands, more new software titles
become available and trade-ins of used video game products applied toward the purchase of new video games lead
to increased sales of new and used video game products. Segment operating income for the 52 weeks ended
35