Freeport-McMoRan 2014 Annual Report Download - page 19
Download and view the complete annual report
Please find page 19 of the 2014 Freeport-McMoRan annual report below. You can navigate through the pages in the report by either clicking on the pages listed below, or by using the keyword search tool below to find specific information within the annual report.-
 1
1 -
2
-
3
-
4
-
5
-
6
-
7
-
8
-
 9
9 -
 10
10 -
 11
11 -
 12
12 -
 13
13 -
 14
14 -
 15
15 -
 16
16 -
 17
17 -
 18
18 -
 19
19 -
 20
20 -
 21
21 -
 22
22 -
 23
23 -
 24
24 -
 25
25 -
 26
26 -
 27
27 -
 28
28 -
 29
29 -
30
-
31
-
32
-
33
-
34
-
35
-
36
-
37
-
38
-
39
-
40
-
41
-
42
-
43
-
44
-
45
-
46
-
47
-
48
-
49
-
50
-
51
-
52
-
53
-
54
-
55
-
56
-
57
-
58
-
59
-
60
-
61
-
62
-
63
-
64
-
65
-
66
-
67
-
68
-
69
-
70
-
71
-
72
-
73
-
74
-
75
-
76
-
77
-
78
-
79
-
80
-
81
-
82
-
83
-
84
-
85
-
86
-
87
-
88
-
89
-
90
-
91
-
92
-
93
-
94
-
95
-
96
-
97
-
98
-
99
-
100
-
101
-
102
-
103
-
104
-
105
-
106
-
107
-
108
-
109
-
110
-
111
-
112
-
113
-
114
-
115
-
116
-
117
-
118
-
119
-
120
-
121
-
122
-
123
-
124
-
125
-
126
-
127
-
128
-
129
-
130
-
131
-
132
-
133
-
134
-
135
-
136
-
137
-
138
-
139
-
140
-
141
-
142
-
143
-
144
 |
 |

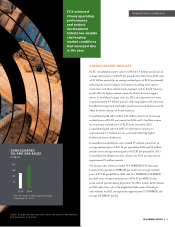
CONSOLIDATED OIL AND GAS MARGINS
per BOE
Photos: (left) FM O&G’s Holstein platform in the Deepwater Gulf of Mexico, already a significant producer, provides
existing infrastructure for future growth; (right) The Holstein platform, with a drill ship at upper left pursuing the
Holstein Deep target
PROVED OIL AND GAS
RESERVES BY REGION
390 MMBOE
4 3 % Gulf of Mexico
39% California
18% Haynesville/Other
+ For the seven-month period from June 1, 2013, to
December 31, 2013.
^ Includes Eagle Ford results through June 19, 2014.
* Includes realized cash losses on derivative contracts of
$0.58 per BOE for 2013 and $2.15 per BOE for 2014.
2013+ 2014^
OPERATING MARGIN
Realized Revenue $ 76.87* $ 71.83*
Cash Production Costs 17.14 20.08
Cash Operating Margin $ 59.73 $ 51.75
17