Freeport-McMoRan 2014 Annual Report Download
Download and view the complete annual report
Please find the complete 2014 Freeport-McMoRan annual report below. You can navigate through the pages in the report by either clicking on the pages listed below, or by using the keyword search tool below to find specific information within the annual report.-
 1
1 -
 2
2 -
 3
3 -
 4
4 -
 5
5 -
 6
6 -
 7
7 -
 8
8 -
 9
9 -
 10
10 -
 11
11 -
 12
12 -
13
-
14
-
15
-
16
-
17
-
18
-
19
-
20
-
21
-
22
-
23
-
24
-
25
-
26
-
27
-
28
-
29
-
30
-
31
-
32
-
33
-
34
-
35
-
36
-
37
-
38
-
39
-
40
-
41
-
42
-
43
-
44
-
45
-
46
-
47
-
48
-
49
-
50
-
51
-
52
-
53
-
54
-
55
-
56
-
57
-
58
-
59
-
60
-
61
-
62
-
63
-
64
-
65
-
66
-
67
-
68
-
69
-
70
-
71
-
72
-
73
-
74
-
75
-
76
-
77
-
78
-
79
-
80
-
81
-
82
-
83
-
84
-
85
-
86
-
87
-
88
-
89
-
90
-
91
-
92
-
93
-
94
-
95
-
96
-
97
-
98
-
99
-
100
-
101
-
102
-
103
-
104
-
105
-
106
-
107
-
108
-
109
-
110
-
111
-
112
-
113
-
114
-
115
-
116
-
117
-
118
-
119
-
120
-
121
-
122
-
123
-
124
-
125
-
126
-
127
-
128
-
129
-
130
-
131
-
132
-
133
-
134
-
135
-
136
-
137
-
138
-
139
-
140
-
141
-
142
-
143
-
144
 |
 |
VALUE AT OUR CORE
2014 ANNUAL REPORT
Table of contents
-
Page 1
VALUE AT OUR CORE 2014 ANNUAL REPORT -
Page 2
... gas trend located in the shallow waters of the Gulf of Mexico and onshore in South Louisiana. In July 2014, the corporate name changed to Freeport-McMoRan Inc. to better reflect FCX's expanded portfolio of assets. Additional information about FCX is available on FCX's website at fcx.com. SUMMARY... -
Page 3
... long-lived reserves, attractive resource potential, strategic investments in growth, responsible management and strong stakeholder partnerships surround the core to create shareholder value. Copper (Cu) Gold (Au) Molybdenum (Mo) Cobalt (Co) Oil Natural Gas TABLE OF CONTENTS 2 Operations 4 Letter... -
Page 4
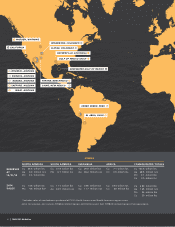
... HENDERSON, COLORADO CALIFORNIA CLIMAX, COLORADO HAYNESVILLE, LOUISIANA GULF OF MEXICO SHELF DEEPWATER GULF OF MEXICO MORENCI, ARIZONA SIERRITA, ARIZONA BAGDAD, ARIZONA SAFFORD, ARIZONA MIAMI, ARIZONA TYRONE, NEW MEXICO CHINO, NEW MEXICO CERRO VERDE, PERU EL ABRA, CHILE MINING NORTH AMERICA... -
Page 5
OPERATIONS GRASBERG, INDONESIA TENKE FUNGURUME, DEMOCRATIC REPUBLIC OF CONGO OIL AND GAS UNITED STATES Oil Natural Gas Natural Gas Liquids MMBOE Oil Natural Gas Natural Gas Liquids MMBOE 278 MMBbls 610 Bcf 10 MMBbls 390 40.1 MMBbls 80.8 Bcf 3.2 MMBbls 56.8 Copper (Cu) Gold (Au) Molybdenum (Mo) ... -
Page 6
... Candelaria/Ojos mining operations in the fourth quarter. Oil and gas production exceeded our forecasts and we were successful in expanding our oil and gas resource base despite the sale of our Eagle Ford shale properties during the year. We progressed several large projects in our minerals and oil... -
Page 7
... the Board RICHARD C. ADKERSON Vice Chairman of the Board President and Chief Executive Ofï¬cer JAMES C. FLORES Vice Chairman of the Board President and Chief Executive Ofï¬cer Freeport-McMoRan Oil & Gas LLC March 23, 2015 Photo: Expsoration program driss core from the Tenke Fungurume minerass... -
Page 8
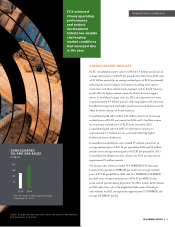
...Net Cash Costs Oil and Gas (per BOE) Cash Production Costs $ 1.88 (0.57) 0.15 0.03 1.49 $ 2014 1.90 (0.60) 0.15 0.06 1.51 $ $ $ 17.14* $ 20.08 * For the seven-month period ending December 31, 2013; CONSOLIDATED COPPER SALES in billion lbs 5;0 4;0 3;0 2;0 1;0 CONSOLIDATED GOLD SALES in million... -
Page 9
... the Eagle Ford shale assets. Oil and gas 2013* 2014 sales volumes for 2015 are expected to approximate 55.5 MMBOE and average 152 MBOE per day. * For the seven-month period ending December 31, 2013; Photo: Energy-efficient bass misss are at the heart of the Morenci miss expansion in Arizona 7 -
Page 10
... of copper and molybdenum. In North America, FCX currently operates seven open-pit copper mines - Morenci, Bagdad, Sierrita, Safford and Miami in Arizona, and Chino and Tyrone in New Mexico, and two molybdenum mines - Henderson and Climax in Colorado. Certain of FCX's North America copper mines also... -
Page 11
... copper mines in the world. NORTH AMERICA UNIT CASH COSTS per lb of copper 2013 UNIT CASH COSTS Site Production and Delivery By-product Credits Treatment Charges Unit Net Cash Costs $ 2.00 (0.24) 0.11 $ 1.87 2014 NORTH AMERICA COPPER SALES in billion lbs 2;0 NORTH AMERICA MOLYBDENUM SALES... -
Page 12
...million pounds of copper and 15 million pounds of molybdenum beginning in 2016. SOUTH AMERICA COPPER RESERVES BY MINE 31;8 billion lbs SOUTH AMERICA UNIT CASH COSTS per lb of copper 2013 2014 $ 1.62 (0.22) 0.17 0.01 1.58 91% 9% Cerro Verde El Abra UNIT CASH COSTS Site Production and Delivery By... -
Page 13
... AMERICA MINING FCX operates two copper mines in South America - Cerro Verde in Peru and El Abra in Chile. In addition to copper, the Cerro Verde mine also produces molybdenum concentrates and silver. On November 3, 2014, FCX completed the sale of its 80 percent ownership interests in the Candelaria... -
Page 14
... and labor-related work stoppages, partly offset by higher gold ore grades. FCX expects sales from Indonesia mining to approximate 1.0 billion pounds of copper and 1.3 million ounces of gold in 2015. Major expansion projects in the Grasberg minerals district center on development of large... -
Page 15
... COPPER RESERVES BY MINE 29;0 billion lbs 7% 93% Open Pit Underground INDONESIA UNIT CASH COSTS per lb of copper 2013 UNIT CASH COSTS Site Production and Delivery $ 2.46 Gold and Silver Credits (1.69) Treatment Charges 0.23 Export Duties Royalty on Metals Unit Net Cash Costs $ - 0.12 1.12 $ 2014... -
Page 16
...COPPER RESERVES 7;1 billion lbs 100% Tenke Fungurume Minerals District AFRICA UNIT CASH COSTS per lb of copper 2013 UNIT CASH COSTS Site Production and Delivery Cobalt Credits Royalty on Metals Unit Net Cash Costs 2014 $ 1.43 (0.29) 0.07 1.21 $ 1.56 (0.48) 0.07 1.15 $ $ AFRICA COPPER SALES... -
Page 17
... expects sales from Africa to approximate 445 million pounds of copper and 32 million pounds of cobalt in 2015. With the second phase expansion of Tenke Fungurume's mining and processing operations complete, exploration activities in the copper-rich African minerals belt target potential resources... -
Page 18
... South Louisiana. During 2014, FM O&G completed the sale of the Eagle Ford shale assets and acquired additional interests in the Deepwater GOM. FCX's oil and gas business has significant proved, probable and possible reserves, a broad range of development opportunities and highpotential exploration... -
Page 19
...Revenue Cash Production Costs Cash Operating Margin + PROVED OIL AND GAS RESERVES BY REGION 390 MMBOE 2014^ $ 71.83* 20.08 $ 51.75 $ 76.87* 17.14 $ 59.73 43% Gulf of Mexico 39% California 18% Haynesville/Other For the seven-month period from June 1, 2013, to December 31, 2013; ^ Includes Eagle... -
Page 20
... reserves, resources and future development opportunities within its portfolio of mining assets. Estimated consolidated recoverable proven and probable mineral reserves at December 31, 2014, included 103.5 billion pounds of copper, 28.5 million ounces of gold, 3.11 billion pounds of molybdenum... -
Page 21
...are FCX's significant reserves, resources and future development opportunities. Exploration drives our mine and oil and gas production plans, and secures long-term value. PROVED, PROBABLE AND POSSIBLE OIL AND GAS RESERVES 973 MMBOE OIL AND GAS RESERVES FCX's oil and gas operations have significant... -
Page 22
... associated with the expansion projects at Morenci and Cerro Verde, and the underground development activities at Grasberg) and $3.2 billion for oil and gas operations. During 2014, FCX completed the sale of the Eagle Ford shale assets for cash consideration of $3.1 billion and the sale of its 80... -
Page 23
...-term pipeline for future growth in reserves and production capacity in established minerals districts and near existing infrastructure. Photos: (seft) Drissing at the Hosstein Deep ois project in the Deepwater Gusf of Mexico; (right) Core drissing in the Safford/Lone Star district in Arizona 21 -
Page 24
People are at the core of our operations around the world. Together with our neighbors and partners, we are working to build stronger, healthier, sustainable communities. 22 -
Page 25
SUSTAINABLE DEVELOPMENT 2014 COMMUNITY INVESTMENT $198 million VALUES AT OUR CORE Just as the natural resources that are at the core of our business are essential to the world's economies, our work with stakeholders on the critical areas of safety and environmental and social responsibility is at ... -
Page 26
...Inc. James C. Flores Vice Chairman of the Board Freeport-McMoRan Inc. President and Chief Executive Officer Freeport-McMoRan Ois & Gas LLC Gerald J. Ford (1, 3, 5) Lead Independent Director Freeport-McMoRan Inc. Chairman of the Board Hisstop Hosdings, Inc. Robert J. Allison, Jr. (2, 3, 4, 5) Retired... -
Page 27
VALUE AT OUR CORE Financial and Opmrating Information TABLE OF CONTENTS 26 Smlmctmd Financial and Opmrating Data 30 Managmmmnt's Discussion and Analysis 79 Managmmmnt's Rmport on Intmrnal Control Ovmr Financial Rmporting 80 Rmport of Indmpmndmnt Rmgistmrmd Public Accounting Firm 81 Rmport of ... -
Page 28
... shares outstanding Dividends declared per share of common stock Operating cash flows Capital expenditures At December 31: Cash and cash equivalents Property, plant, equipment and mining development costs, net Oil and gas properties, net Goodwill Total assets Total debt, including current portion... -
Page 29
... Gold (thousands of recoverable ounces) Production Sales, excluding purchases Average realized price per ounce Molybdenum (millions of recoverable pounds) Production Sales, excluding purchases Average realized price per pound NORTH AMERICA COPPER MINES Operating Data, Net of Joint Venture Interest... -
Page 30
... Years Ended December 31, 2014 2013 2012 2011 2010 SOUTH AMERICA MINING (continued) Mill operations Ore milled (metric tons per day) Average ore grade: Copper (percent) Gold (grams per metric ton) Molybdenum (percent) Copper recovery rate (percent) Copper production (millions of recoverable... -
Page 31
... AND OPERATING DATA Years Ended December 31, 2014 2013 2012 2011 2010 MOLYBDENUM MINES Molybdenum production (millions of recoverable pounds) Ore milled (metric tons per day)c Average molybdenum ore grade (percent)c OIL AND GAS OPERATIONSd Sales Volumes: Oil (million barrels) Natural gas... -
Page 32
... America; the Tenke Fungurume (Tenke) minerals district in the Democratic Republic of Congo (DRC) in Africa; and significant oil and natural gas assets in the U.S., including reserves in the Deepwater Gulf of Mexico (GOM), onshore and offshore California, in the Haynesville shale play in Louisiana... -
Page 33
... oil and gas production costs. Consolidated Operating Cash Flow. Our consolidated operating cash flows vary with prices realized from copper, gold, molybdenum and oil sales, our sales volumes, production costs, income taxes and other working capital changes and other factors. Based on current sales... -
Page 34
... on December 31, 2014. Gold prices closed at $1,208 per ounce on February 20, 2015. LME Copper Prices Exchange Stocks This graph presents LME spot copper prices and combined reported stocks of copper at the LME, Commodity Exchange Inc. (COMEX), a division of the New York Mercantile Exchange (NYMEX... -
Page 35
... methods we use and the related costs incurred to develop and mine our reserves. Our estimates of recoverable proven and probable mineral reserves are prepared by and are the responsibility of our employees. A majority of these estimates are reviewed annually and verified by independent experts... -
Page 36
... of operations, including changes to prospective depreciation rates and impairments of asset carrying values. Excluding impacts associated with changes in the levels of finished goods inventories and based on projected copper sales volumes for 2015, if estimated copper reserves at our mines were... -
Page 37
... mining operations, fair value is determined through the use of discounted estimated future cash flows. The estimated cash flows used to assess recoverability of our long-lived assets and measure fair value of our mining operations are derived from current business plans, which are developed... -
Page 38
... on our oil and gas production levels or costs. flows, discount rates and forward prices. The excess of acquisition consideration over the fair values of assets acquired and liabilities assumed is recorded as goodwill. In connection with our oil and gas acquisitions in 2013, we recorded goodwill... -
Page 39
...to our current plans, (iii) the methods used or required to plug and abandon non-producing oil and gas wellbores, remove platforms, tanks, production equipment and flow lines, and restore the wellsite could change, (iv) calculating the fair value of our AROs requires management to estimate projected... -
Page 40
...2013 2012 Revenues North America copper mines South America mining Indonesia mining Africa mining Molybdenum mines Rod & Refining Atlantic Copper Smelting & Refining U.S. oil & gas operations Other mining, corporate, other & eliminations Total revenues Operating income (loss) North America copper... -
Page 41
...) related to our preferred stock investment in and the subsequent acquisition of McMoRan Exploration Co. Refer to Note 11 and "Provision for Income Taxes" below for further discussion. Includes net working capital uses and changes in other tax payments of $632 million in 2014, $377 million in 2013... -
Page 42
... our oil and gas operations. In connection with the acquisition of Plains Exploration & Production Company (PXP), we have derivative contracts for 2015 consisting of crude oil options, and for 2013 and 2014, had derivative contracts that consisted of crude oil options and swaps and natural gas swaps... -
Page 43
... of export restrictions on PT-FI's operating rates totaling $0.04 per pound of copper. Lower consolidated unit site production and delivery costs in 2013, compared with 2012, primarily reflect higher copper sales volumes in Indonesia and South America. Assuming achievement of current 2015 volume... -
Page 44
... Tenke minerals district. The drilling data in North America also continue to indicate the potential for significantly expanded sulfide production. Drilling results and exploration modeling in North America have identified large-scale potential sulfide resources in the Morenci and Safford/Lone Star... -
Page 45
... open-pit copper mines in North America - Morenci, Bagdad, Safford, Sierrita and Miami in Arizona, and Chino and Tyrone in New Mexico. All of the North America mining operations are wholly owned, except for Morenci. We record our 85 percent interest in the Morenci unincorporated joint venture using... -
Page 46
... reported by other companies. Operating Data. Following is summary operating data for the North America copper mines for the years ended December 31: 2014 2013 2012 Operating Data, Net of Joint Venture Interest Copper (recoverable) Production (millions of pounds) 1,670 Sales, excluding purchases... -
Page 47
...per pound for each $2 per pound change in the average price of molybdenum during 2015. 2013 2012 Molybdenuma By-Product Method Co-Product Method Copper Molybdenuma By-Product Method Co-Product Method Copper Revenues, excluding adjustments Site production and delivery, before net noncash and other... -
Page 48
... Data. Following is summary operating data for our South America mining operations for the years ended December 31. 2014 a 2013 2012 South America Mining We operate two copper mines in South America - Cerro Verde in Peru (in which we own a 53.56 percent interest) and El Abra in Chile (in which we... -
Page 49
... basis, South America's unit depreciation rate may vary with asset additions and the level of copper production and sales. The increase in unit depreciation in 2014, compared with 2013, primarily relates to asset additions at Cerro Verde. Revenue adjustments primarily result from changes in prices... -
Page 50
... current mine plans, PT-FI anticipates that it will be allocated most of the production and related revenues and costs through 2021. Under the joint venture arrangements, PT-FI's share of copper production and sales totaled 98 percent in 2014, 99 percent in 2013 and 100 percent in 2012, and of gold... -
Page 51
... than those relating to the export duties, the smelter bond and royalties described above will be changed until the completion of an amended COW. PT-FI is advancing plans for the construction of new smelter capacity in parallel with completing negotiations of its long-term operating rights and will... -
Page 52
...annual production of copper and gold. Consolidated sales volumes from our Indonesia mining operations are expected to approximate 1.0 billion pounds of copper and 1.3 million ounces of gold for 2015. PT-FI has updated its mine plans to incorporate lower than planned mining rates associated with work... -
Page 53
... copper in 2013, compared with $1.24 per pound in 2012, primarily reflecting higher volumes. Operating Data. Following is summary operating data for our Africa mining operations for the years ended December 31. Africa Mining Africa mining includes Tenke Fungurume Mining S.A.'s (TFM) Tenke minerals... -
Page 54
... sales reported in our consolidated financial statements. 2014 2013 By-Product Method Co-Product Method Copper Cobalt Unit Net Cash Costs. Unit net cash costs per pound of copper is a measure intended to provide investors with information about the cash-generating capacity of our mining operations... -
Page 55
... includes sales of molybdenum produced at our molybdenum mines and at our North and South America copper mines, and refer to "Outlook" for projected consolidated molybdenum sales volumes. Smelting & Reï¬ning We wholly own and operate a smelter in Miami, Arizona, and Atlantic Copper, a smelter and... -
Page 56
... acquisitions. Oil and Gas Operations Our portfolio of oil and gas assets includes significant oil production facilities and growth potential in the Deepwater GOM, established oil production facilities onshore and offshore California, large onshore natural gas resources in the Haynesville shale... -
Page 57
... percent oil, 28 percent natural gas and 5 percent NGLs. Deepwater Gulf of Mexico. Multiple development and exploration opportunities have been identified in the Deepwater GOM that are expected to benefit from tieback opportunities to available production capacity at the FM O&G-operated large-scale... -
Page 58
... expected to commence in mid-2015. This infill drilling program will target undrained fault blocks and updip resource potential just east of the Horn Mountain facility. KOQV is located in approximately 5,500 feet of water. In December 2014, the Power Nap exploration well in the Vito area encountered... -
Page 59
...- South America Mining") and for Cerro Verde's general corporate purposes. At December 31, 2014, there were $425 million of borrowings and no 2013 CAPITAL RESOURCES AND LIQUIDITY Our consolidated operating cash flows vary with prices realized from copper, gold, molybdenum and oil, our sales volumes... -
Page 60
... cash flows for 2013, compared with 2012, resulted from our oil and gas operations, higher copper and gold sales volumes and a decrease in working capital uses and changes in other tax payments, primarily associated with changes in accrued income taxes, inventories and accounts receivable. Partly... -
Page 61
...as estimated funding for pension obligations as the funding may vary from year to year based on changes in the fair value of plan assets and actuarial assumptions, commitments and contingencies totaling $191 million and unrecognized tax benefits totaling $68 million where the timing of settlement is... -
Page 62
... environmental matters. DISCLOSURES ABOUT MARKET RISKS Commodity Price Risk Metals. Our consolidated revenues from our mining operations include the sale of copper concentrates, copper cathodes, copper rod, gold, molybdenum and other metals by our North and South America mines, the sale of copper... -
Page 63
...the December 31, 2014, fair values approximates $51 million. Refer to Note 14 for further discussion of our crude oil and natural gas derivative contracts. At December 31, 2014, we had provisionally priced copper sales at our copper mining operations, primarily South America and Indonesia, totaling... -
Page 64
... change. Oil & Gas Product Revenues and Cash Production Costs per Unit Realized revenues and cash production costs per unit are measures intended to provide investors with information about the cash operating margin of our oil and gas operations expressed on a basis relating to each product sold... -
Page 65
... North America copper mines to our molybdenum sales company at market-based pricing. Includes gold and silver product revenues and production costs. Represents the combined total for all other mining operations and the related eliminations, as presented in Note 16. Includes impairment of oil and gas... -
Page 66
...2,797 Reflects sales of molybdenum by certain of the North America copper mines to our molybdenum sales company at market-based pricing. Includes gold and silver product revenues and production costs. Includes $76 million ($0.05 per pound) associated with updated mine plans at Morenci that resulted... -
Page 67
... a. Reflects sales of molybdenum by certain of the North America copper mines to our molybdenum sales company at market-based pricing. b. Includes gold and silver product revenues and production costs. c. Represents the combined total for all other mining operations and the related eliminations, as... -
Page 68
MANAGEMENT'S DISCUSSION AND ANALYSIS South America Mining Product Revenues and Production Costs By-Product Method Co-Product Method Copper Other Total Year Ended December 31, 2014 (In millions) Revenues, excluding adjustments Site production and delivery, before net noncash and other costs shown ... -
Page 69
MANAGEMENT'S DISCUSSION AND ANALYSIS South America Mining Product Revenues and Production Costs (continued) By-Product Method Co-Product Method Copper Other Total Year Ended December 31, 2013 (In millions) Revenues, excluding adjustments Site production and delivery, before net noncash and other ... -
Page 70
...'S DISCUSSION AND ANALYSIS South America Mining Product Revenues and Production Costs (continued) By-Product Method Co-Product Method Copper Other Total Year Ended December 31, 2012 (In millions) Revenues, excluding adjustments Site production and delivery, before net noncash and other costs... -
Page 71
... charges Export duties Royalty on metals Noncash and other costs, net Revenue adjustments, primarily for pricing on prior period open sales PT Smelting intercompany profit Indonesia mining Other mining & eliminationsc Total mining U.S. oil & gas operations Corporate, other & eliminations As reported... -
Page 72
MANAGEMENT'S DISCUSSION AND ANALYSIS Indonesia Mining Product Revenues and Production Costs (continued) By-Product Method Co-Product Method Copper Gold Silver Total Year Ended December 31, 2013 (In millions) Revenues, excluding adjustments Site production and delivery, before net noncash and ... -
Page 73
...'S DISCUSSION AND ANALYSIS Indonesia Mining Product Revenues and Production Costs (continued) By-Product Method Co-Product Method Copper Gold Silver Total Year Ended December 31, 2012 (In millions) Revenues, excluding adjustments Site production and delivery, before net noncash and other... -
Page 74
... Africa mining Other mining & eliminationsc Total mining U.S. oil & gas operations Corporate, other & eliminations As reported in FCX's consolidated financial statements a. b. c. d. Includes point-of-sale transportation costs as negotiated in customer contracts. Net of cobalt downstream processing... -
Page 75
... sales Africa mining Other mining & eliminationsc Total mining U.S. oil & gas operations Corporate, other & eliminations As reported in FCX's consolidated financial statements a. Includes point-of-sale transportation costs as negotiated in customer contracts. b. Net of cobalt downstream processing... -
Page 76
... sales Africa mining Other mining & eliminationsc Total mining U.S. oil & gas operations Corporate, other & eliminations As reported in FCX's consolidated financial statements a. Includes point-of-sale transportation costs as negotiated in customer contracts. b. Net of cobalt downstream processing... -
Page 77
... years 2014 and 2013 include the combined results of the Henderson and Climax mines; the year 2012 reflects the results of only the Henderson mine as start-up activities were still under way at the Climax mine. b. Reflects sales of the molybdenum mines' production to the molybdenum sales company at... -
Page 78
... Oil & Gas Product Revenues, Cash Production Costs and Realizations Year Ended December 31, 2014 (In millions) Oil Natural Gas NGLs Total U.S. Oil & Gas Oil and gas revenues before derivatives Realized cash losses on derivative contracts Realized revenues Less: cash production costs Cash operating... -
Page 79
...Seven months from June 1, 2013, to December 31, 2013 (In millions) Oil Natural Gas NGLs Total U.S. Oil & Gas Oil and gas revenues before derivatives Realized cash (losses) gains on derivative contracts Realized revenues Less: cash production costs Cash operating margin Less: depreciation, depletion... -
Page 80
... of copper, gold, molybdenum, cobalt, crude oil and natural gas price changes; the impact of derivative positions; the impact of deferred intercompany profits on earnings; reserve estimates; future dividend payments; debt reduction; and share purchases. The words "anticipates," "may," "can," "plans... -
Page 81
... or timely detection of unauthorized acquisition, use or disposition of the Company's assets that could have a material effect on the financial statements. Richard C. Adkerson Vice Chairman of the Board, President and Chief Executive Officer Kathleen L. Quirk Executive Vice President, Chief... -
Page 82
... with the standards of the Public Company Accounting Oversight Board (United States), the consolidated balance sheets of Freeport-McMoRan Inc. as of December 31, 2014 and 2013, and the related consolidated statements of operations, comprehensive (loss) income, equity and cash flows for each of... -
Page 83
... Freeport-McMoRan Copper & Gold Inc.) as of December 31, 2014 and 2013, and the related consolidated statements of operations, comprehensive (loss) income, equity and cash flows for each of the three years in the period ended December 31, 2014. These financial statements are the responsibility... -
Page 84
... per share amounts) 2014 2013 2012 Revenues Cost of sales: Production and delivery Depreciation, depletion and amortization Impairment of oil and gas properties Total cost of sales Selling, general and administrative expenses Mining exploration and research expenses Environmental obligations and... -
Page 85
... (LOSS) INCOME Years Ended December 31, (In millions) 2014 2013 2012 Net (loss) income Other comprehensive (loss) income, net of taxes: Defined benefit plans: Actuarial (losses) gains arising during the period Prior service costs arising during the period Amortization of unrecognized amounts... -
Page 86
...North America copper mines South America Indonesia Africa Molybdenum mines United States oil and gas operations Other Acquisition of Deepwater Gulf of Mexico interests Acquisition of Plains Exploration & Production Company, net of cash acquired Acquisition of MMR, net of cash acquired Acquisition of... -
Page 87
... value) 2014 2013 ASSETS Current assets: Cash and cash equivalents Trade accounts receivable Income and other tax receivables Other accounts receivable Inventories: Mill and leach stockpiles Materials and supplies, net Product Other current assets Total current assets Property, plant, equipment... -
Page 88
... Balance at December 31, 2012 Common stock issued to acquire Plains Exploration & Production Company Exchange of employee stock-based awards in connection with acquisitions Exercised and issued stock-based awards Stock-based compensation Reserve of tax benefit for stock-based awards Tender of shares... -
Page 89
...Atlantic Copper) and FCX Oil & Gas Inc. (FM O&G). FCX acquired mining assets in North America, South America and Africa when it acquired Phelps Dodge Corporation (now known as FMC) in 2007. FCX acquired oil and gas operations when it acquired Plains Exploration & Production Company (PXP) and McMoRan... -
Page 90
... Costs. Property, plant, equipment and mining development costs are carried at cost. Mineral exploration costs, as well as drilling and other costs incurred for the purpose of converting mineral resources to proven and probable reserves or identifying new Asset Impairment for Mining Operations. FCX... -
Page 91
...with production, operations, marketing and general corporate activities are charged to expense as incurred. Capitalized costs, along with estimated future costs to develop proved reserves and asset retirement costs that are not already included in oil and gas properties, net of related salvage value... -
Page 92
... or major expansion is considered to be a continuation of existing mining activities, stripping costs are accounted for as a current production cost and a component of the associated inventory. Asset Retirement Obligations. FCX records the fair value of estimated asset retirement obligations (AROs... -
Page 93
... concentrate sales, Tenke Fungurume Mining S.A. (TFM or Tenke) metal sales and certain Sociedad Minera Cerro Verde S.A.A. (Cerro Verde) metal sales are subject to certain royalties, which are recorded as a reduction to revenues. In addition, PT-FI concentrate sales are also subject to export duties... -
Page 94
... AND ACQUISITIONS Candelaria and Ojos del Salado Disposition. On November 3, 2014, FCX completed the sale of its 80 percent ownership interests in the Candelaria and Ojos del Salado copper mining operations and supporting infrastructure (Candelaria/Ojos) located in Chile to Lundin Mining Corporation... -
Page 95
... the mineral PXP and MMR Acquisitions. FCX acquired PXP on May 31, 2013, and MMR on June 3, 2013. These acquisitions added a portfolio of oil and gas assets to FCX's global mining business, creating a U.S.-based natural resources company. The portfolio of oil and gas assets included oil production... -
Page 96
...acquisition of PXP on May 31, 2013. The following table summarizes the final purchase price allocations for PXP and MMR: PXP MMR Eliminations Total Current assets Oil and gas properties - full cost method: Subject to amortization Not subject to amortization Property, plant and equipment Investment... -
Page 97
... the properties acquired by PXP in 2012 from BP Exploration & Production Inc., BP America Production Company and Shell Offshore Inc. The Preferred Stock represents a 20 percent equity interest in Plains Offshore and is entitled to a dividend of 8 percent per annum, payable quarterly, of which... -
Page 98
... North America, South America and the Tenke minerals district in the Democratic Republic of Congo (DRC). At December 31, 2014, FMC's operating mines in North America were Morenci, Bagdad, Safford, Sierrita and Miami located in Arizona; Tyrone and Chino located in New Mexico; and Henderson and Climax... -
Page 99
... reserves and all its mining operations are located in the Block A area. PT-FI receives 100 percent of production and related revenues from reserves established as of December 31, 1994 (27.1 billion pounds of copper, 38.4 million ounces of gold and 75.8 million ounces of silver), divided into annual... -
Page 100
..., 2014 2013 Accounts payable Salaries, wages and other compensation Accrued interest a Other accrued taxes Pension, postretirement, postemployment and other employee beneï¬tsb Deferred revenue Oil and gas royalty and revenue payable Commodity derivative contracts Rio Tinto's share of joint venture... -
Page 101
... net debt to earnings before interest, taxes, depreciation and amortization (EBITDA) ratio as defined in the agreement. Amounts may be drawn or letters of credit may be issued over a two-year period to fund a portion of Cerro Verde's expansion project and for Cerro Verde's general corporate purposes... -
Page 102
... was entered into in December 2012 to provide interim financing for the acquisitions of PXP and MMR but was replaced December 31, 2014 2013 Pension, postretirement, postemployment and other employment beneï¬tsa Reserve for uncertain tax beneï¬ts Commodity derivative contracts Other Total other... -
Page 103
... is developed based on pricing and yield information for high-quality corporate bonds. Changes in the discount rate are reflected in FCX's benefit obligation and, therefore, in future pension costs. Other FCX Plans. In February 2004, FCX established an unfunded Supplemental Executive Retirement Plan... -
Page 104
... expects its pension assets will earn an average of 7.75 percent per annum beginning January 1, 2015. The discount rate assumption for PT-FI's plan is based on the Mercer Indonesian zero coupon bond yield curve derived from the Indonesian Government Security Yield Curve. Changes in the discount rate... -
Page 105
...Government bonds Emerging markets equity Corporate bonds Mutual funds: Foreign bonds Emerging markets equity Emerging markets bond Fixed income: Government bonds Corporate bonds Private equity investments Other investments Total investments Cash and receivables Payables Total pension plan net assets... -
Page 106
... employees or other A summary of the fair value hierarchy for pension plan assets associated with the PT-FI plan follows: Fair Value at December 31, 2014 Total Level 1 Level 2 Level 3 Common stocks Government bonds Mutual funds Total investments Cash and receivablesa Total pension plan net assets... -
Page 107
... position; copper, molybdenum, gold, crude oil and natural gas prices; the price of FCX's common stock; and general economic and market conditions. FCX's Board of Directors (the Board) authorized an increase in the cash dividend on FCX's common stock in February 2012 to the current annual rate of... -
Page 108
... dividends) at the date of grant. The risk-free interest rate is based on Federal Reserve rates in effect for bonds with maturity dates equal to the expected term of the option or SAR. Information related to stock options during the years ended December 31 follows: 2014 2013 2012 Selling... -
Page 109
... compared to the total shareholder return of a peer group. The total grant date target shares related to the 2014 PSU grants were 344 thousand, of which the executive officers will earn from 0 percent to 200 percent. Prior to 2014, a portion of each executive officer's annual bonus was to be paid in... -
Page 110
... income tax benefit in 2012. d. Benefit from the use of federal operating loss carryforwards acquired as part of the oil and gas acquisitions. a. Under terms of the related plans, upon exercise of stock options and vesting of RSUs, employees may tender existing FCX shares to FCX to pay the exercise... -
Page 111
...Minimum tax credits Net operating loss carryforwards Employee beneï¬t plans Other Deferred tax assets Valuation allowances Net deferred tax assets Deferred tax liabilities: Property, plant, equipment and mining development costs Oil and gas properties Undistributed earnings Other Total deferred tax... -
Page 112
... tax credits and net operating loss carryforwards. In 2010, the Chilean legislature approved an increase in mining royalty taxes to help fund earthquake reconstruction activities, education and health programs. Mining royalty taxes at FCX's El Abra and Candelaria mines were stabilized through 2017... -
Page 113
... smelter sites principally located in Arizona, Kansas, New Jersey, Oklahoma and Pennsylvania; and uranium mining sites in the western U.S. The recorded environmental obligations for these sites totaled $1.0 billion at December 31, 2014. FCX may also be subject to litigation brought by private... -
Page 114
... at various times owned or operated copper and zinc smelters in states including Arizona, Kansas, New Jersey, Oklahoma and Pennsylvania. For some of these smelter sites, certain FCX subsidiaries have been advised by EPA or state agencies that they may be liable for costs of investigating and, if... -
Page 115
... platforms, tanks, production equipment and flow lines, and restore wellsites could change over time. New Mexico, Arizona, Colorado and other states require financial assurance to be provided for the estimated costs of mine reclamation and closure, including groundwater quality protection programs... -
Page 116
... of mining operations. During 2014, FCX met with the Colorado Division of Reclamation Mining & Safety (DRMS) regarding the inclusion of long-term water management costs in its closure plans, and Henderson updated its closure cost estimate in the fourth quarter of 2014 for long-term water management... -
Page 117
...FCX challenging FCX's 2013 acquisitions of PXP and MMR. Pursuant to the Stipulation, insurers under FCX's directors and officers liability insurance policies will fund $115 million (Settlement Amount) to FCX. The settlement is conditioned upon FCX's Board declaring a special dividend in an aggregate... -
Page 118
... at December 31, 2014, primarily for the Cerro Verde royalty dispute (refer to discussion above), environmental and asset retirement obligations, workers' compensation insurance programs, tax and customs obligations, and other commercial obligations. In addition, FCX had surety bonds totaling $275... -
Page 119
..., including PT-FI's joint venture partner's share. As a result of the settlement, FCX recorded a gain of $59 million in 2012. the prevailing market rate for the service or commodity purchased. In some cases, the amount of the actual obligation may change over time because of market conditions... -
Page 120
...-FI at fair value, and timely granting rights for the continuation of operations from 2022 through 2041. Negotiations are taking into consideration PT-FI's need for assurance of legal and fiscal terms post-2021 for PT-FI to continue with its large-scale investment program for the development of its... -
Page 121
... net sales revenue from production to a community development fund to assist the local communities with development of local infrastructure and related services, such as those pertaining to health, education and economic development. TFM charged $4 million in each of the years 2014, 2013 and 2012 to... -
Page 122
... Natural Gas Contracts. As a result of the acquisition of PXP, FCX has derivative contracts for 2015 that consist of crude oil options. These crude oil derivatives are not designated as hedging instruments and are recorded at fair value with the mark-to-market gains and losses recorded in revenues... -
Page 123
...sales/purchase contracts Crude oil and natural gas derivatives a Copper derivatives Balance sheet classiï¬cation: Trade accounts receivable Other current assets Accounts payable and accrued liabilities Other liabilities $ 15 316 - 331 $ 63 - 6 69 $ 93 - 7 100 $ 16 313 1 330 a. Amounts recorded... -
Page 124
... equivalents, accounts receivable, accounts payable and accrued liabilities, and dividends payable follows: At December 31, 2014 Carrying Amount Total Fair Value Level 1 Level 2 Level 3 Assets Investment securities:a,b,c U.S. core fixed income fund Money market funds Equity securities Total $ 23... -
Page 125
...- 15 1 154 Legally restricted funds:a,b,d U.S. core fixed income fund Government mortgage-backed securities Corporate bonds Government bonds and notes Money market funds Asset-backed securities Municipal bonds Total Derivatives:a,e Embedded derivatives in provisional sales/purchase contracts in... -
Page 126
... income securities (U.S. core fixed income funds, government securities, corporate bonds, asset-backed securities and municipal bonds) are valued using a bid evaluation price or a mid-evaluation price. A bid evaluation price is an estimated price at which a dealer would pay for a security. A mid... -
Page 127
...), Cerro Verde (included in South America mining), Grasberg (Indonesia mining) and Tenke (Africa mining) copper mines, the Rod & Refining operations and the U.S. oil & gas operations. Intersegment sales between FCX's mining operations are based Reï¬ned copper products Copper in concentrates a Gold... -
Page 128
... in Colorado. The Henderson and Climax mines produce highpurity, chemical-grade molybdenum concentrates, which are typically further processed into value-added molybdenum chemical products. Rod & Reï¬ning. The Rod & Refining segment consists of copper conversion facilities located in North America... -
Page 129
... by Business Segment Mining Operations North America Copper Mines South America Indonesia Africa Atlantic Copper Other Molybdenum Rod & Smelting Mining & Tenke Mines Refining & Refining Eliminations U.S. Corporate, Oil & Gas Other & Operations Eliminations Morenci Other Mines Total Cerro Verde... -
Page 130
...) Mining Operations North America Copper Mines South America Indonesia Africa Atlantic Copper Other Molybdenum Rod & Smelting Mining & Tenke Mines Refining & Refining Eliminations U.S. Corporate, Oil & Gas Other & Operations Eliminations Morenci Other Mines Total Cerro Verde Other Mines Total... -
Page 131
... 31, 2014 FCX Issuer FM O&G LLC Guarantor Non-guarantor Subsidiaries Eliminations Consolidated FCX ASSETS Current assets: Cash and cash equivalents Accounts receivable Other current assets Total current assets Property, plant, equipment and mining development costs, net Oil and gas properties... -
Page 132
... 31, 2013 FCX Issuer FM O&G LLC Guarantor Non-guarantor Subsidiaries Eliminations Consolidated FCX ASSETS Current assets: Cash and cash equivalents Accounts receivable Other current assets Total current assets Property, plant, equipment and mining development costs, net Oil and gas properties... -
Page 133
... FCX Revenues Total costs and expenses Operating (loss) income Interest expense, net Net (loss) gain on early extinguishment of debt Gain on investment in MMR Other income (expense), net (Loss) income before income taxes and equity in affiliated companies' net earnings (losses) Benefit from... -
Page 134
... by operating activities Cash flow from investing activities: Capital expenditures Acquisition of Deepwater GOM interests Intercompany loans Dividends from (investments in) consolidated subsidiaries Net proceeds from sale of Candelaria and Ojos del Salado Net proceeds from sale of Eagle Ford shale... -
Page 135
... in) provided by operating activities: Depreciation, depletion and amortization Net losses on crude oil and natural gas derivative contracts Gain on investment in MMR Equity in (earnings) losses of consolidated subsidiaries Other, net Decreases (increases) in working capital and changes in other tax... -
Page 136
... are appropriately addressed in these financial statements. NOTE 19. QUARTERLY FINANCIAL INFORMATION (UNAUDITED) First Quarter Second Quarter Third Quarter Fourth Quarter Year 2014 Revenues Operating income (loss) Net income (loss) Net income and preferred dividends attributable to noncontrolling... -
Page 137
... or produced at the time of the reserve determination. Recoverable Proven and Probable Mineral Reserves Estimated at December 31, 2014 Coppera (billion pounds) Gold (million ounces) Molybdenum (billion pounds) North America South America Indonesia Africa Consolidatedb Net equity interestc 35.6 31... -
Page 138
...Proven and Probable Reserves b Gold (million ounces) Molybdenum (billion pounds) North America Developed and producing: Morenci Bagdad Safford Sierrita Miami Chino Tyrone Henderson Climax Undeveloped: Cobre South America Developed and producing: Cerro Verde El Abra Indonesia Developed and producing... -
Page 139
...CONSOLIDATED FINANCIAL STATEMENTS NOTE 21. SUPPLEMENTARY OIL AND GAS INFORMATION (UNAUDITED) Costs Incurred. A summary of the costs incurred for FCX's oil and gas acquisition, exploration and development activities for the years ended December 31 follows: 2014 2013 a FCX expects that 48 percent of... -
Page 140
.... Because all oil and natural gas reserve estimates are to some degree subjective, the quantities of oil and natural gas that are ultimately recovered, production and operating costs, the amount and timing of future development expenditures and future crude oil and natural gas sales prices may all... -
Page 141
... its Eagle Ford properties. From June 1, 2013, to December 31, 2013, FCX sold reserves in-place totaling 1 MMBOE related to its Panhandle properties. Excluding the impact of crude oil derivative contracts, the average realized sales prices used in FCX's reserve reports as of December 31, 2014, were... -
Page 142
... 2014. Our comparative peer groups are the S&P 500 Materials Index and the S&P 500 Energy Index, which closely mirror the benchmarks of other large companies in the materials and energy sectors. This comparison assumes $100 invested on December 31, 2009, in (a) Freeport-McMoRan Inc. common stock... -
Page 143
... be contacted as follows: Freeport-McMoRan Inc. Investor Relations Department 333 North Central Avenue Phoenix, AZ 85004 Telephone (602) 366-8400 fcx.com COMMON STOCK DIVIDENDS Below is a summary of cash dividends declared and paid on FCX common stock in 2014 and 2013. 2014 AMOUNT PER SHARE RECORD... -
Page 144
333 North Central Avenue Phoenix, Arizona 85004 602.366.8100 fcx.com