Freeport-McMoRan 2003 Annual Report Download - page 6
Download and view the complete annual report
Please find page 6 of the 2003 Freeport-McMoRan annual report below. You can navigate through the pages in the report by either clicking on the pages listed below, or by using the keyword search tool below to find specific information within the annual report.-
 1
1 -
 2
2 -
 3
3 -
 4
4 -
 5
5 -
 6
6 -
 7
7 -
 8
8 -
 9
9 -
 10
10 -
 11
11 -
 12
12 -
 13
13 -
 14
14 -
 15
15 -
 16
16 -
 17
17 -
18
-
19
-
20
-
21
-
22
-
23
-
24
-
25
-
26
-
27
-
28
-
29
-
30
-
31
-
32
-
33
-
34
-
35
-
36
-
37
-
38
-
39
-
40
-
41
-
42
-
43
-
44
-
45
-
46
-
47
-
48
-
49
-
50
-
51
-
52
-
53
-
54
-
55
-
56
-
57
-
58
-
59
-
60
-
61
-
62
-
63
-
64
-
65
-
66
-
67
-
68
-
69
-
70
-
71
-
72
-
73
-
74
-
75
-
76
-
77
-
78
-
79
-
80
 |
 |

REAL ASSETS – LEADING POSITION
MINING AND MILLING
PT Freeport Indonesia’s Grasberg mine and surrounding
minerals complex is well known as one of the world’s
greatest ore bodies. It is one of the world’s largest
copper mines, contains the richest single deposit of
gold, and positions FCX to be a leading supplier of
copper and gold for decades to come. Because of
the richness of the deposit, the good fortune of its
“two metals in one mine” content, and world-class
operating efficiencies, the company has consistently
maintained its industry leading cost position. For
2003, PT Freeport Indonesia reported record-low
average unit net cash production costs of a net credit
of $(0.02) per pound of copper, compared with $0.08
per pound in 2002. In other words, our gold revenues
more than offset our cash costs to produce copper.
This “by-product” calculation – using the gold and silver
we produce as a credit to offset our production costs
– is consistent with industry standard reporting for
cash costs. However, our operations would also be
among the low-cost global leaders for both copper
and gold separately if we allocated production
costs based on relative revenues under the
“co-product” method.
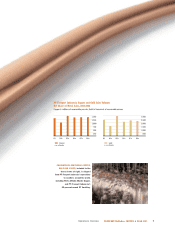
Mill throughput from production from PT Freeport
Indonesia’s mines averaged 203,000 metric tons of
ore per day in 2003 and 235,600 metric tons of ore
per day in 2002. PT Freeport Indonesia’s Grasberg
open-pit mine averaged 155,700 metric tons of ore
per day in 2003 and 194,500 metric tons of ore per
day in 2002. The lower mill throughput rate and lower
production volumes for the full-year 2003 reflect
the impact of the Grasberg open pit slippage events
in the fourth quarter of 2003 and the subsequent
clean-up efforts.
Production from PT Freeport Indonesia’s Deep Ore
Zone (DOZ) underground mine nearly doubled last
year, with an average of 40,500 metric tons of ore per
day during 2003 compared with 21,800 metric tons
of ore per day for 2002. DOZ operations continue to
4FREEPORT-McMoRan COPPER & GOLD INC. 2003 Annual Report
OPERATIONS OVERVIEW