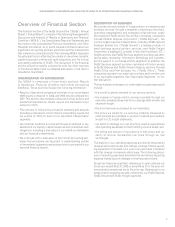
Federal Express 2009 Annual Report Download - page 15
Download and view the complete annual report
Please find page 15 of the 2009 Federal Express annual report below. You can navigate through the pages in the report by either clicking on the pages listed below, or by using the keyword search tool below to find specific information within the annual report.
MANAGEMENT’S DISCUSSION AND ANALYSIS
13
The impairment of the Kinko’s trade name was due to the deci-
sion to minimize the use of the Kinko’s trade name and rebrand
the company as FedEx Offi ce over the next several years. We
believe the FedEx Offi ce name better describes the wide range of
services available at the company’s retail centers and takes full
advantage of the FedEx brand. The goodwill impairment charge
resulted from a decline in the fair value of the FedEx Office
reporting unit in light of economic conditions, the unit’s recent
and forecasted fi nancial performance and the decision to reduce
the rate of network expansion. These 2008 impairment charges
are included in operating expenses in the accompanying consoli-
dated statements of income. The charges were included in the
results of the FedEx Services segment and were not allocated to
our transportation segments, as the charges were unrelated to
the core performance of those businesses.
Operating Income
The following table compares operating expenses as a percent
of revenue for the years ended May 31:
Percent of Revenue
2009 2008 2007
Operating expenses:
Salaries and employee benefi ts 38.8% 37.4% 39.0%
Purchased transportation 12.8 12.2 11.3
Rentals and landing fees 6.8 6.4 6.7
Depreciation and amortization 5.6 5.1 5.0
Fuel 10.7 11.6 9.7
Maintenance and repairs 5.3 5.5 5.5
Impairment and other charges 3.4 2.3 –
Other 14.5 14.0 13.5
Total operating expenses 97.9 94.5 90.7
Operating margin 2.1% 5.5% 9.3%
Operating income and operating margin declined signifi cantly in
2009, as weak economic conditions drove decreases in volumes
at FedEx Express and the FedEx Freight LTL Group and contributed
to a more competitive pricing environment that pressured yields.
The impairment and other charges described above also nega-
tively impacted operating income and margin in 2009. Operating
income and margin in 2009 were also negatively impacted by
reduced base copy revenues and expenses associated with
organizational changes at FedEx Offi ce. The cost-reduction ini-
tiatives (described above) partially mitigated the negative impact
of these factors.
The following graphs for our transportation segments show our
average cost of jet and vehicle fuel per gallon and the year-over-
year percentage change in total fuel expense for the years ended
May 31:
Fuel expenses decreased 14% during 2009, primarily due to
decreases in fuel consumption and the average price per gallon
of fuel. Jet fuel usage decreased 9% during 2009, as we reduced
fl ight hours in light of lower business levels.
Average Fuel Cost
per Gallon
$2.04 $2.12
$2.77 $2.62
$2.56 $2.65
$3.31
$3.04
$3.75
$3.25
$2.75
$2.25
$1.75
$1.25 2006 2007 2008 2009
Jet
Vehicle
Year-Over-Year Percentage Change in
Total Fuel Expense
8%
29%
-14%
45%
30%
15%
0%
-15%
-30% 2006/2007 2007/2008 2008/2009
Fuel Expense
MANAGEMENT’S DISCUSSION AND ANALYSIS
13
The impairment of the Kinko’s trade name was due to the deci-
sion to minimize the use of the Kinko’s trade name and rebrand
the company as FedEx Office over the next several years. We
believe the FedEx Office name better describes the wide range of
services available at the company’s retail centers and takes full
advantage of the FedEx brand. The goodwill impairment charge
resulted from a decline in the fair value of the FedEx Office
reporting unit in light of economic conditions, the unit’s recent
and forecasted financial performance and the decision to reduce
the rate of network expansion. These 2008 impairment charges
are included in operating expenses in the accompanying consoli-
dated statements of income. The charges were included in the
results of the FedEx Services segment and were not allocated to
our transportation segments, as the charges were unrelated to
the core performance of those businesses.
Operating Income
The following table compares operating expenses as a percent
of revenue for the years ended May 31:
Percent of Revenue
2009 2008 2007
Operating expenses:
Salaries and employee benefits 38.8% 37.4% 39.0%
Purchased transportation 12.8 12.2 11.3
Rentals and landing fees 6.8 6.4 6.7
Depreciation and amortization 5.6 5.1 5.0
Fuel 10.7 11.6 9.7
Maintenance and repairs 5.3 5.5 5.5
Impairment and other charges 3.4 2.3 –
Other 14.5 14.0 13.5
Total operating expenses 97.9 94.5 90.7
Operating margin 2.1% 5.5% 9.3%
Operating income and operating margin declined significantly in
2009, as weak economic conditions drove decreases in volumes
at FedEx Express and the FedEx Freight LTL Group and contributed
to a more competitive pricing environment that pressured yields.
The impairment and other charges described above also nega-
tively impacted operating income and margin in 2009. Operating
income and margin in 2009 were also negatively impacted by
reduced base copy revenues and expenses associated with
organizational changes at FedEx Office. The cost-reduction ini-
tiatives (described above) partially mitigated the negative impact
of these factors.
The following graphs for our transportation segments show our
average cost of jet and vehicle fuel per gallon and the year-over-
year percentage change in total fuel expense for the years ended
May 31:
Fuel expenses decreased 14% during 2009, primarily due to
decreases in fuel consumption and the average price per gallon
of fuel. Jet fuel usage decreased 9% during 2009, as we reduced
flight hours in light of lower business levels.
Average Fuel Cost
per Gallon
$2.04 $2.12
$2.77
$2.62
$2.56 $2.65
$3.31
$3.04
$3.75
$3.25
$2.75
$2.25
$1.75
$1.25 2006 2007 2008
2009
JetVehicle
Year-Over-Year Percentage Change in
Total Fuel Expense
8%
29%
-14%
45%
30%
15%
0%
-15%
-30% 2006/2007 2007/2008
2008/2009
Fuel Expense


