Fannie Mae 2007 Annual Report Download - page 7
Download and view the complete annual report
Please find page 7 of the 2007 Fannie Mae annual report below. You can navigate through the pages in the report by either clicking on the pages listed below, or by using the keyword search tool below to find specific information within the annual report.-
 1
1 -
 2
2 -
 3
3 -
 4
4 -
 5
5 -
 6
6 -
 7
7 -
 8
8 -
 9
9 -
 10
10 -
 11
11 -
 12
12 -
 13
13 -
 14
14 -
 15
15 -
 16
16 -
 17
17 -
 18
18 -
19
-
20
-
21
-
22
-
23
-
24
-
25
-
26
-
27
-
28
-
29
-
30
-
31
-
32
-
33
-
34
-
35
-
36
-
37
-
38
-
39
-
40
-
41
-
42
-
43
-
44
-
45
-
46
-
47
-
48
-
49
-
50
-
51
-
52
-
53
-
54
-
55
-
56
-
57
-
58
-
59
-
60
-
61
-
62
-
63
-
64
-
65
-
66
-
67
-
68
-
69
-
70
-
71
-
72
-
73
-
74
-
75
-
76
-
77
-
78
-
79
-
80
-
81
-
82
-
83
-
84
-
85
-
86
-
87
-
88
-
89
-
90
-
91
-
92
-
93
-
94
-
95
-
96
-
97
-
98
-
99
-
100
-
101
-
102
-
103
-
104
-
105
-
106
-
107
-
108
-
109
-
110
-
111
-
112
-
113
-
114
-
115
-
116
-
117
-
118
-
119
-
120
-
121
-
122
-
123
-
124
-
125
-
126
-
127
-
128
-
129
-
130
-
131
-
132
-
133
-
134
-
135
-
136
-
137
-
138
-
139
-
140
-
141
-
142
-
143
-
144
-
145
-
146
-
147
-
148
-
149
-
150
-
151
-
152
-
153
-
154
-
155
-
156
-
157
-
158
-
159
-
160
-
161
-
162
-
163
-
164
-
165
-
166
-
167
-
168
-
169
-
170
-
171
-
172
-
173
-
174
-
175
-
176
-
177
-
178
-
179
-
180
-
181
-
182
-
183
-
184
-
185
-
186
-
187
-
188
-
189
-
190
-
191
-
192
-
193
-
194
-
195
-
196
-
197
-
198
-
199
-
200
-
201
-
202
-
203
-
204
-
205
-
206
-
207
-
208
-
209
-
210
-
211
-
212
-
213
-
214
-
215
-
216
-
217
-
218
-
219
-
220
-
221
-
222
-
223
-
224
-
225
-
226
-
227
-
228
-
229
-
230
-
231
-
232
-
233
-
234
-
235
-
236
-
237
-
238
-
239
-
240
-
241
-
242
-
243
-
244
-
245
-
246
-
247
-
248
-
249
-
250
-
251
-
252
-
253
-
254
-
255
-
256
-
257
-
258
-
259
-
260
-
261
-
262
-
263
-
264
-
265
-
266
-
267
-
268
-
269
-
270
-
271
-
272
-
273
-
274
-
275
-
276
-
277
-
278
-
279
-
280
-
281
-
282
-
283
-
284
-
285
-
286
-
287
-
288
-
289
-
290
-
291
-
292
 |
 |

5
2007 ANNUAL REPORT
FANNIE MAE’S MARKET ROOM
Here’s how our results broke out by
business segment:
• Our Single-Family Credit Guaranty
business works with our lender
customers to securitize single-family
mortgage loans into Fannie Mae
mortgage-backed securities. We
provide a guaranty that ensures the
timely payment of principal and
interest on the mortgage-backed
securities. For that service, we
charge a guaranty fee. In 2007, our
Single-Family guaranty fee income
grew by 22 percent to $5.8 billion.
But credit-related expenses, including
charge-offs on failed loans and the
cost of selling foreclosed properties,
rose signifi cantly to $5.0 billion.
Together with other expenses,
including administrative costs and
losses on certain guaranty contracts,
the Single-Family business posted a
net loss of $858 million.
• Our Housing and Community
Development business securitizes
multifamily loans into Fannie Mae
mortgage-backed securities, and
invests debt and equity in affordable
housing. We receive a guaranty
fee for assuming the credit risk
on the mortgage loans underlying
multifamily Fannie Mae mortgage-
backed securities, while many of our
investments in affordable housing
projects generate tax benefi ts. In
2007, the multifamily guaranty book
of business grew by 22.5 percent in a
booming rental housing market, and
multifamily credit-related expenses
remained low. Net income for the
HCD business was $157 million.
• Our Capital Markets group manages
our investments in mortgage-related
assets. Net interest income, the
primary driver of Capital Markets
revenue, fell 25 percent in 2007.
The compression in our net interest
yield was driven by the replacement
of older, maturing debt with new
issuances at higher rates. Capital
Markets also had higher unrealized
investment losses on our trading
portfolio and signifi cantly higher
derivatives fair value losses, which
I mentioned earlier. Capital Markets’
net loss was $1.35 billion. Capital
Markets is a central and, I believe,
profi table part of our business
model over the long haul, but its
sensitivity to changes in interest
rates and market spreads makes
its performance extremely volatile
quarter-to-quarter and even
year-to-year.
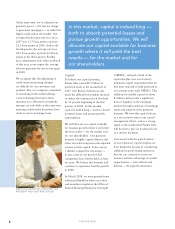
STEPHEN M. SWAD, EXECUTIVE VICE PRESIDENT
AND CHIEF FINANCIAL OFFICER