Fannie Mae 2001 Annual Report Download - page 3
Download and view the complete annual report
Please find page 3 of the 2001 Fannie Mae annual report below. You can navigate through the pages in the report by either clicking on the pages listed below, or by using the keyword search tool below to find specific information within the annual report.-
 1
1 -
 2
2 -
 3
3 -
 4
4 -
 5
5 -
 6
6 -
 7
7 -
 8
8 -
 9
9 -
 10
10 -
 11
11 -
 12
12 -
 13
13 -
 14
14 -
15
-
16
-
17
-
18
-
19
-
20
-
21
-
22
-
23
-
24
-
25
-
26
-
27
-
28
-
29
-
30
-
31
-
32
-
33
-
34
-
35
-
36
-
37
-
38
-
39
-
40
-
41
-
42
-
43
-
44
-
45
-
46
-
47
-
48
-
49
-
50
-
51
-
52
-
53
-
54
-
55
-
56
-
57
-
58
-
59
-
60
-
61
-
62
-
63
-
64
-
65
-
66
-
67
-
68
-
69
-
70
-
71
-
72
-
73
-
74
-
75
-
76
-
77
-
78
-
79
-
80
-
81
-
82
-
83
-
84
-
85
-
86
 |
 |

{ 1} Fannie Mae 2001 Annual Report
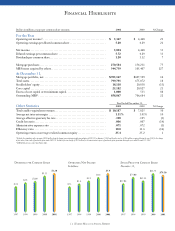
Financial Highlights
Dollars in millions, except per common share amounts 2001 2000 % Change
For the Year
Operating net income1. . . . . . . . . . . . . . . . . . . . . . . . . . . . . . . . . . . . . . . . . . . . . . . . . $5,367 $4,448 21
Operating earnings per diluted common share . . . . . . . . . . . . . . . . . . . . . . . . . . . . 5.20 4.29 21
Net income . . . . . . . . . . . . . . . . . . . . . . . . . . . . . . . . . . . . . . . . . . . . . . . . . . . . . . . . . . . 5,894 4,448 33
Diluted earnings per common share. . . . . . . . . . . . . . . . . . . . . . . . . . . . . . . . . . . . . . 5.72 4.29 33
Dividends per common share. . . . . . . . . . . . . . . . . . . . . . . . . . . . . . . . . . . . . . . . . . . . 1.20 1.12 7
Mortgage purchases . . . . . . . . . . . . . . . . . . . . . . . . . . . . . . . . . . . . . . . . . . . . . . . . . . . . 270,584 154,231 75
MBS issues acquired by others. . . . . . . . . . . . . . . . . . . . . . . . . . . . . . . . . . . . . . . . . . . 344,739 105,407 227
At December 31,
Mortgage portfolio, net. . . . . . . . . . . . . . . . . . . . . . . . . . . . . . . . . . . . . . . . . . . . . . . . . $705,167 $607,399 16
Total assets . . . . . . . . . . . . . . . . . . . . . . . . . . . . . . . . . . . . . . . . . . . . . . . . . . . . . . . . . . . . 799,791 675,072 18
Stockholders’ equity. . . . . . . . . . . . . . . . . . . . . . . . . . . . . . . . . . . . . . . . . . . . . . . . . . . . 18,118 20,838 (13)
Core capital . . . . . . . . . . . . . . . . . . . . . . . . . . . . . . . . . . . . . . . . . . . . . . . . . . . . . . . . . . . 25,182 20,827 21
Excess of core capital over minimum capital. . . . . . . . . . . . . . . . . . . . . . . . . . . . . . . 1,000 533 88
Outstanding MBS2. . . . . . . . . . . . . . . . . . . . . . . . . . . . . . . . . . . . . . . . . . . . . . . . . . . . . 858,867 706,684 22
Year Ended December 31,
Other Statistics 2001 2000 % Change
To tal taxable-equivalent revenues . . . . . . . . . . . . . . . . . . . . . . . . . . . . . . . . . . . . . . . . $10,187 $ 7,825 30
Average net interest margin . . . . . . . . . . . . . . . . . . . . . . . . . . . . . . . . . . . . . . . . . . . . . 1.11% 1.01% 10
Average effective guaranty fee rate . . . . . . . . . . . . . . . . . . . . . . . . . . . . . . . . . . . . . . . .190 .195 (3)
Credit loss ratio. . . . . . . . . . . . . . . . . . . . . . . . . . . . . . . . . . . . . . . . . . . . . . . . . . . . . . . . .006 .007 (14)
Administrative expense ratio . . . . . . . . . . . . . . . . . . . . . . . . . . . . . . . . . . . . . . . . . . . . .071 .072 (1)
Efficiency ratio . . . . . . . . . . . . . . . . . . . . . . . . . . . . . . . . . . . . . . . . . . . . . . . . . . . . . . . . 10.0 11.6 (14)
Operating return on average realized common equity . . . . . . . . . . . . . . . . . . . . . . 25.4 25.2 1
1Excludes the cumulative after-tax gain of $168 million from the change in accounting principle upon adoption of FAS 133 on January 1, 2001 and the after-tax loss of $24 million recognized during the year 2001 for the change
in fair value of time value of purchased options under FAS 133. Includes after-tax charges of $383 million for the amortization expense of purchased options premiums during the year ended December 31, 2001.
2MBS held by investors other than Fannie Mae.