FairPoint Communications 2003 Annual Report Download - page 13
Download and view the complete annual report
Please find page 13 of the 2003 FairPoint Communications annual report below. You can navigate through the pages in the report by either clicking on the pages listed below, or by using the keyword search tool below to find specific information within the annual report.
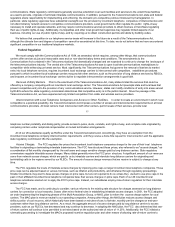
There is no established public market for the common equity securities of the Company. Substantially all of the Company's outstanding
common equity securities are owned by affiliates of Kelso & Company, or Kelso, Thomas H. Lee Equity Fund IV, L.P., or THL, certain
institutional investors and the Company's executive officers and directors.
As of December 31, 2003, there were approximately 69 record holders of the Company's class A common stock and 6 record holders of
the Company's class C common stock.
There were 6,737,674 options to purchase shares of class A common stock outstanding as of December 31, 2003, of which 5,429,514
were fully vested. These were 144,506 restricted stock units representing our class A common stock outstanding as of December 31, 2003,
none of which were vested.
Other than 2,065,134 stock options and 144,506 restricted stock units issued pursuant to the 1998 plan and 2000 plan, the Company
did not sell unregistered equity securities during the past three years. We believe that the issuance of the stock options and restricted stock
units were exempt from the registration requirements of the Securities Act of 1933, or the Securities Act, under Rule 701 or Section 4(2) of
the Securities Act.
Our ability to pay dividends is governed by restrictive covenants contained in the indentures governing our senior notes and senior
subordinated notes as well as restrictive covenants in our bank lending arrangements. We have never paid cash dividends on our common
equity securities and currently have no intention of paying cash dividends on our common equity securities for the foreseeable future. For a
description of certain restrictions on our ability to pay dividends, see "Item 7. Management's Discussion and Analysis of Financial Condition
and Results of Operations-Description of Certain Indebtedness."
For a description of our equity compensation plans, see "Item 11. Executive Compensation."
Certain of the selected financial data presented below under the captions "Statement of Operations," "Operating Data," "Summary
Cash Flow Data" and "Balance Sheet Data" as of December 31, 2002 and 2003, and for each of the years in the three-year period ended
December 31, 2003, are derived from the consolidated financial statements of the Company and its subsidiaries, which financial statements
have been audited by KPMG LLP, independent auditors. The consolidated financial statements as of December 31, 2002 and 2003, and of
each of the years in the three-year period ended December 31, 2003, and the report thereon, are included elsewhere in this annual Report.
The following financial information should be read in conjunction with "Item 7. Management's Discussion and Analysis of Financial
Condition and Results of Operations" and "Item 8. Independent Auditor's Report and Consolidated Financial Statements." Amounts in
thousands, except access lines and ratios.
19
Revenues $133,475 $190,786 $230,176 $230,819 $231,432
Operating expenses:
Operating costs 71,214 95,540 115,763 110,265 111,188
Depreciation and amortization(1) 29,964 46,146 55,081 46,310 48,089
Stock based compensation expense 3,386 12,323 1,337 924 15
Total operating expenses 104,564 154,009 172,181 157,499 159,292
Income from operations 28,911 36,777 57,995 73,320 72,140
Interest expense(2) (50,464) (59,556) (76,314) (69,520) (90,224)
Other income (expense), net(3) 4,877 13,198 (6,670) (11,974) 9,600
Loss from continuing operations before income taxes (16,676) (9,581) (24,989) (8,174) (8,484)
Income tax (expense) benefit(3) (2,179) (5,607) (431) (518) 236
Minority interest in income of subsidiaries (100) (3) (2) (2) (2)
Loss from continuing operations (18,955) (15,191) (25,422) (8,694) (8,250)
Income (loss) from discontinued operations (10,085) (73,926) (186,178) 21,933 9,921
Net income (loss) (29,040) (89,117) (211,600) 13,239 1,671
Redeemable preferred stock dividends and accretion(2) — — — (11,918) (8,892)
Gain on repurchase of redeemable preferred stock — — — — 2,905
Net income (loss) attributable to common shareholders $(29,040)$(89,117)$(211,600)$1,321 $(4,316)
EBITDA(4) 63,652 96,118 106,404 107,654 129,827
Capital expenditures 27,773 49,601 43,175 38,803 33,595
Access line equivalents(5) 150,612 237,294 247,862 248,581 264,308
Residential access lines 120,387 184,798 191,570 189,803 196,145
Business access lines 30,225 51,025 53,056 51,810 50,226
DSL lines — 1,471 3,236 6,968 17,937
Ratio of earnings to fixed charges(6) — — — — —


