Exxon 2010 Annual Report Download - page 12
Download and view the complete annual report
Please find page 12 of the 2010 Exxon annual report below. You can navigate through the pages in the report by either clicking on the pages listed below, or by using the keyword search tool below to find specific information within the annual report.-
 1
1 -
 2
2 -
 3
3 -
 4
4 -
 5
5 -
 6
6 -
 7
7 -
 8
8 -
 9
9 -
 10
10 -
 11
11 -
 12
12 -
 13
13 -
 14
14 -
 15
15 -
 16
16 -
 17
17 -
 18
18 -
 19
19 -
 20
20 -
 21
21 -
 22
22 -
23
-
24
-
25
-
26
-
27
-
28
-
29
-
30
-
31
-
32
-
33
-
34
-
35
-
36
-
37
-
38
-
39
-
40
-
41
-
42
-
43
-
44
 |
 |

Corporate
FINANCIAL HIGHLIGHTS 2010 2009 2008 2007 2006
(millions of dollars, unless noted)
Sales and other operating revenue(1)370,125
301,500 459,579 390,328 365,467
Net income attributable to ExxonMobil 30,460
19,280 45,220 40,610 39,500
Cash flow from operations and asset sales(2) 51,674
29,983 65,710 56,206 52,366
Capital and exploration expenditures(2) 32,226
27,092 26,143 20,853 19,855
Cash dividends to ExxonMobil shareholders 8,498
8,023 8,058 7,621 7,628
Common stock purchases (gross) 13,093
19,703 35,734 31,822 29,558
Research and development costs 1,012
1,050 847 814 733
Cash and cash equivalents at year end(3) 7,825
10,693 31,437 33,981 28,244
Total assets at year end 302,510
233,323 228,052 242,082 219,015
Total debt at year end 15,014
9,605 9,425 9,566 8,347
ExxonMobil share of equity at year end 146,839
110,569 112,965 121,762 113,844
Average capital employed(2) 145,217
125,050 129,683 128,760 122,573
Share price at year end (dollars) 73.12
68.19 79.83 93.69 76.63
Market valuation at year end 364,035
322,329 397,239 504,220 438,990
Regular employees at year end (thousands) 83.6
80.7 79.9 80.8 82.1
KEY FINANCIAL RATIOS 2010 2009 2008 2007 2006
Earnings per common share (dollars) 6.24
3.99 8.70 7.31 6.64
Earnings per common share – assuming dilution (dollars) 6.22
3.98 8.66 7.26 6.60
Return on average capital employed(2) (percent) 21.7
16.3 34.2 31.8 32.2
Earnings to average ExxonMobil share of equity (percent) 23.7
17.3 38.5 34.5 35.1
Debt to capital(4) (percent) 9.0
7.7 7.4 7.1 6.6
Net debt to capital(5) (percent) 4.5
(1.0)(23.0)(24.0)(20.4)
Current assets to current liabilities (times) 0.94
1.06 1.47 1.47 1.55
Fixed charge coverage (times) 42.2
25.8 54.6 51.6 47.8
(1) Sales and other operating revenue include sales-based taxes of $28,547 million for 2010, $25,936 million for 2009, $34,508 million for 2008, $31,728 for 2007,
and $30,381 for 2006.
(2) See Frequently Used Terms on pages 36 through 37.
(3) Excluding restricted cash of $628 million in 2010 and $4,604 million in 2006.
(4) Debt includes short- and long-term debt. Capital includes short- and long-term debt and total equity.
(5) Debt net of cash and cash equivalents, excluding restricted cash.
The ExxonMobil Business Model ExxonMobil has a consistent
and straightforward business model that combines a long-term perspective, focus
on operational excellence, delivery of superior cash flow, and a disciplined approach
to capital investment to grow shareholder value. Our business model is enduring.
Testing our projects across a range of economic scenarios ensures resiliency
throughout the business cycle and enables us to continue to deliver superior
long-term value to our shareholders.
I
n
d
u
s
t
r
y
-
L
e
a
d
i
n
g
R
e
t
u
r
n
s
D
i
s
c
i
p
l
i
n
e
d
I
n
v
e
s
t
m
e
n
t
O
p
e
r
a
t
i
o
n
a
l
E
x
c
e
l
l
e
n
c
e
S
u
p
e
r
i
o
r
C
a
s
h
F
l
o
w
EricWhetstone•WhetstoneDesign
office:214-583-6118•cell:
ED ITOR
GloriaMoncada•InvestorRelations
ExxonMobilCorporation,Irving,TX
office:972-444-1151•cell:310-505-2771
fax:972-444-1505
gloria.moncada@exxonmobil.com
CarolZuber-Mallison•ZMGraphics,Inc.
studio/cell:214-906-4162•fax:817-924-7784
carol@zmgraphics.com
Usage:ExclusiverightswithinExxonMobil
(c)2011,ZMGraphics,Inc.Imagecannotberesold
ATTENTI ON:O WNER
Datalistisusedtodrivetheblackand
whitechart,whichisthenusedasa
templateforthecolorchart.Barsand
linesarecutandpastedfromtheblack
andwhitetemplateandarehighly
accurate.However,thecolorchartis
NOTlinkedtothedatabaseandisNOT
“driven”bythedata;itisapieceof
artworkbuiiltbyahuman.Therefore,the
editorneedstothoroughlyproofthefinal
artwork,notJUSTthedatalist.
VE RSION
APPROVEDBY
Moncada/IR
Jan.09,2011
FI LEIN FO
LASTFILECHANGEMADEBY
03A10XOMFO-
VirtuousCircle.ai
INF&OONPAGE
INSARONPAGE
Note:
03A
S31A
Includeslinkfile
ISIN
SARandF&O
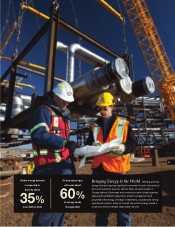
GROWTH IN
SHAREHOLDER
VALUE