Epson 2014 Annual Report Download - page 4
Download and view the complete annual report
Please find page 4 of the 2014 Epson annual report below. You can navigate through the pages in the report by either clicking on the pages listed below, or by using the keyword search tool below to find specific information within the annual report.-
 1
1 -
 2
2 -
 3
3 -
 4
4 -
 5
5 -
 6
6 -
 7
7 -
 8
8 -
 9
9 -
 10
10 -
 11
11 -
 12
12 -
 13
13 -
 14
14 -
 15
15 -
16
-
17
-
18
-
19
-
20
-
21
-
22
-
23
-
24
-
25
-
26
-
27
-
28
-
29
-
30
-
31
-
32
-
33
-
34
-
35
-
36
-
37
-
38
-
39
-
40
-
41
-
42
-
43
-
44
-
45
-
46
-
47
-
48
-
49
-
50
-
51
-
52
-
53
-
54
-
55
-
56
-
57
-
58
-
59
-
60
-
61
-
62
-
63
-
64
-
65
-
66
-
67
-
68
-
69
-
70
-
71
-
72
-
73
-
74
-
75
-
76
-
77
-
78
-
79
-
80
-
81
-
82
-
83
-
84
-
85
-
86
-
87
-
88
-
89
-
90
-
91
-
92
-
93
-
94
-
95
-
96
-
97
-
98
-
99
 |
 |

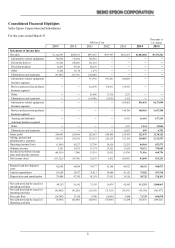
Consolidated Financial Highlights
Seiko Epson Corporation and Subsidiaries
For the years ended March 31
Millions of yen
Thousands of
U.S. dollars
2009
2010
2011
2012
2013
2014
2014
Statements of income data
Net sales
¥1,122,497
¥985,363
¥973,663
¥877,997
¥851,297
¥1,003,606
$9,751,321
Information-related equipment
769,850
712,692
702,918
―
―
―
―
Electronic devices
311,626
248,001
231,235
―
―
―
―
Precision products
72,697
57,746
68,276
―
―
―
―
Other
31,828
19,714
1,279
―
―
―
―
Eliminations and corporate
(63,506)
(52,791)
(30,046)
―
―
―
―
Information-related equipment
business segment
― ― 713,936 691,801 688,029 ― ―
Devices and precision products
business segment
― ― 212,670 174,811 156,872 ― ―
Other
―
―
61,446
17,316
1,273
―
―
Eliminations and corporate
―
―
(14,390)
(5,932)
5,122
―
―
Information-related equipment
business segment
― ― ― ― 685,862 836,436 8,127,050
Devices and precision products
business segment
― ― ― ― 140,790 148,956 1,447,298
Sensing and industrial
solutions business segment
― ― ― ― 11,413 16,181 157,219
Other
―
―
―
―
1,273
1,334
12,962
Eliminations and corporate
―
―
―
―
11,957
699
6,792
Gross profit
289,443
259,469
262,963
248,846
234,439
322,976
3,138,126
Selling, general and
administrative expenses
291,031 241,241 230,253 224,219 213,184 238,007 2,312,553
Operating income (loss)
(1,588) 18,227 32,709 24,626 21,255 84,968 825,573
Ordinary income
5,301
13,875
31,174
27,022
17,629
78,121
759,045
Income (loss) before income
taxes and minority interests
(89,559) (799) 15,381 15,622 (3,479) 71,916 698,756
Net income (loss)
(111,322)
(19,791)
10,239
5,032
(10,091)
83,698
813,233
Research and development
costs
82,058 68,849 54,377 52,106 49,923 50,531 490,973
Capital expenditures
55,624
25,937
31,813
38,908
43,155
37,825
367,518
Depreciation and amortization
78,406
47,395
41,159
37,651
39,320
38,725
376,263
Net cash provided by (used in)
operating activities
44,253 56,542 32,395 26,678 42,992 111,253 1,080,965
Net cash provided by (used in)
investing activities
(61,002) (43,203) (23,615) (31,528) (39,511) (39,519) (383,977)
Free cash flow
(16,748)
13,338
8,780
(4,849)
3,480
71,733
696,978
Net cash provided by (used in)
financing activities
(9,558)
(41,087)
(42,691)
(57,406)
21,298
(56,567)
(549,621)
3