Epson 2013 Annual Report Download - page 5
Download and view the complete annual report
Please find page 5 of the 2013 Epson annual report below. You can navigate through the pages in the report by either clicking on the pages listed below, or by using the keyword search tool below to find specific information within the annual report.-
 1
1 -
 2
2 -
 3
3 -
 4
4 -
 5
5 -
 6
6 -
 7
7 -
 8
8 -
 9
9 -
 10
10 -
 11
11 -
 12
12 -
 13
13 -
 14
14 -
 15
15 -
 16
16 -
17
-
18
-
19
-
20
-
21
-
22
-
23
-
24
-
25
-
26
-
27
-
28
-
29
-
30
-
31
-
32
-
33
-
34
-
35
-
36
-
37
-
38
-
39
-
40
-
41
-
42
-
43
-
44
-
45
-
46
-
47
-
48
-
49
-
50
-
51
-
52
-
53
-
54
-
55
-
56
-
57
-
58
-
59
-
60
-
61
-
62
-
63
-
64
-
65
-
66
-
67
-
68
-
69
-
70
-
71
-
72
-
73
-
74
-
75
-
76
-
77
-
78
-
79
-
80
-
81
-
82
-
83
-
84
-
85
-
86
-
87
-
88
-
89
-
90
-
91
-
92
-
93
-
94
-
95
-
96
-
97
-
98
-
99
-
100
 |
 |

4
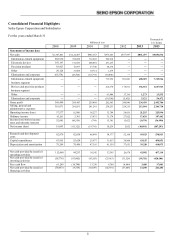
Millions of yen
Thousands of
U.S. dollars
2008 2009 2010 2011 2012 2013 2013
Balance sheet data
Current assets ¥737,245 ¥617,677 ¥596,210 ¥543,530 ¥487,190 ¥519,457 $5,523,211
Property, plant and equipment (net of
accumulated depreciation)
343,261 253,712 225,354 213,623 213,086 217,388 2,311,419
Total assets 1,139,165 917,342 870,090 798,229 740,769 778,547 8,278,011
Current liabilities 385,123 283,848 328,652 315,422 313,314 326,688 3,473,568
Noncurrent liabilities 282,595 314,862 258,574 211,999 179,314 193,052 2,052,652
Net assets 471,446 318,631 282,864 270,808 248,140 258,806 2,751,791
Number of employees
Information-related equipment 47,862 41,748 45,863 44,711 ― ―
Electronic devices 29,609 19,818 22,439 20,659 ― ―
Precision products 6,576 6,038 5,839 5,985 ― ―
Information-related equipment
business segment
― ― ― ― 55,841 50,823
Devices and precision products
business segment
― ― ― ― 16,101 13,859
Other 2,417 2,151 590 245 249 241
Corporate 2,461 2,571 3,206 2,951 3,112 3,838
Total 88,925 72,326 77,936 74,551 75,303 68,761
Per share data (yen and U.S. dollars)
Net income (loss) ¥97.24 (¥566.92) (¥99.34) ¥51.25 ¥26.22 (¥56.41) ($0.59)
Cash dividends 32.00 35.00 7.00 20.00 26.00 20.00 0.21
Shareholders’ equity 2,277.45 1,541.16 1,407.92 1,347.71 1,377.60 1,435.20 15.25
Financial ratios (%)
Shareholders’ equity ratio 39.3 33.0 32.3 33.7 33.3 33.0
ROE (net income (loss)/average
shareholders’ equity at beginning and
end of year)
4.2 (29.7) (6.8) 3.7 2.0 (4.0)
ROA (ordinary income/ average total
assets at beginning and end of year) 5.2 0.5 1.6 3.7 3.5 2.3
ROS
(operating income (loss) / net sales) 4.3 (0.1) 1.8 3.4 2.8 2.5
Notes
1. U.S. dollar amounts have been translated from yen, for convenience only, at the rate of ¥94.05 =U.S.$1 as of March 31, 2013.
2. Ordinary income is a common item on financial statements in Japan, which is calculated by adding to or subtracting from operating
income items such as interest income, rent income, interest expenses and foreign exchange gains or losses.
3. In this table, cash dividends per share refers to the amount paid for each share in each fiscal year.
4. Shareholders’ equity is net assets excluding minority interests.