Emerson 2010 Annual Report Download - page 3
Download and view the complete annual report
Please find page 3 of the 2010 Emerson annual report below. You can navigate through the pages in the report by either clicking on the pages listed below, or by using the keyword search tool below to find specific information within the annual report.-
 1
1 -
 2
2 -
 3
3 -
 4
4 -
 5
5 -
 6
6 -
 7
7 -
 8
8 -
 9
9 -
 10
10 -
 11
11 -
 12
12 -
 13
13 -
 14
14 -
15
-
16
-
17
-
18
-
19
-
20
-
21
-
22
-
23
-
24
-
25
-
26
-
27
-
28
-
29
-
30
-
31
-
32
-
33
-
34
-
35
-
36
-
37
-
38
-
39
-
40
-
41
-
42
-
43
-
44
-
45
-
46
-
47
-
48
-
49
-
50
-
51
-
52
-
53
-
54
-
55
-
56
-
57
-
58
-
59
-
60
-
61
-
62
-
63
-
64
 |
 |

2010 Annual Report
1
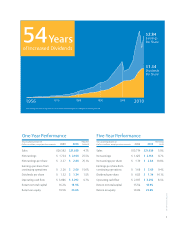
One-Year Performance
Years ended September 30 percent
Dollars in millions, except per share amounts 2009 2010 change
Sales $20,102 $21,039 4.7%
Net earnings $ 1,724 $ 2,164 25.5%
Net earnings per share $ 2.27 $ 2.84 25.1%
Earnings per share from
continuing operations $ 2.26 $ 2.60 15.0%
Dividends per share $ 1.32 $ 1.34 1.5%
Operating cash flow $ 3,086 $ 3,292 6.7%
Return on total capital 16.2% 18.9%
Return on equity 19.5% 23.6%
Five-Year Performance
Years ended September 30 five-year
Dollars in millions, except per share amounts 2005 2010 cagr
Sales $15,774 $21,039 5.9%
Net earnings $ 1,422 $ 2,164 8.7%
Net earnings per share $ 1.70 $ 2.84 10.8%
Earnings per share from
continuing operations $ 1.66 $ 2.60 9.4%
Dividends per share $ 0.83 $ 1.34 10.1%
Operating cash flow $ 2,187 $ 3,292 8.5%
Return on total capital 15.5% 18.9%
Return on equity 19.4% 23.6%
54Years
of Increased Dividends
$2.84
Earnings
Per Share
$1.34
Dividends
Per Share
1956 1970 1980 1990 2000 2010
2002 earnings per share is before the $1.12 per share cumulative effect of a change in accounting principle.