Emerson 2008 Annual Report Download - page 2
Download and view the complete annual report
Please find page 2 of the 2008 Emerson annual report below. You can navigate through the pages in the report by either clicking on the pages listed below, or by using the keyword search tool below to find specific information within the annual report.-
 1
1 -
 2
2 -
 3
3 -
 4
4 -
 5
5 -
 6
6 -
 7
7 -
 8
8 -
 9
9 -
 10
10 -
 11
11 -
 12
12 -
 13
13 -
14
-
15
-
16
-
17
-
18
-
19
-
20
-
21
-
22
-
23
-
24
-
25
-
26
-
27
-
28
-
29
-
30
-
31
-
32
-
33
-
34
-
35
-
36
-
37
-
38
-
39
-
40
-
41
-
42
-
43
-
44
-
45
-
46
-
47
-
48
-
49
-
50
-
51
-
52
-
53
-
54
-
55
-
56
-
57
-
58
-
59
-
60
-
61
-
62
-
63
-
64
-
65
 |
 |

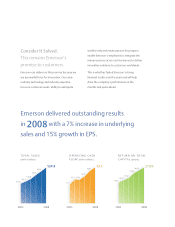
This remains Emerson’s
promise to customers.
Emerson can deliver on this promise because we
are a powerful force for innovation. Our extra-
ordinary technology and industry expertise,
focus on customer needs, ability to anticipate
Emerson delivered outstanding results
in with a 7% increase in underlying
sales and 15% growth in EPS.
world trends and innate passion for progress
enable Emerson’s employees to integrate the
many resources across our businesses to deliver
innovative solutions to customers worldwide.
This is what has fueled Emerson’s strong
nancial results over the years and will help
drive the company’s performance in the
months and years ahead.
TOTAL SALES
(dollars in billions)
OPERATING CASH
FLOW (dollars in billions)
R E T U R N O N T O T A L
CAPITAL (percent)
2008
2003
2003
2008
2003
2008
14.2%
15.5%
18.4%
20.1%
12.7%
$2.2 $2.2
$2.5
$3.0
$1.7
$15.2
$16.9
$19.7
$22.1
$13.6