Einstein Bros 2008 Annual Report Download - page 18
Download and view the complete annual report
Please find page 18 of the 2008 Einstein Bros annual report below. You can navigate through the pages in the report by either clicking on the pages listed below, or by using the keyword search tool below to find specific information within the annual report.-
 1
1 -
2
-
3
-
4
-
5
-
6
-
7
-
 8
8 -
 9
9 -
 10
10 -
 11
11 -
 12
12 -
 13
13 -
 14
14 -
 15
15 -
 16
16 -
 17
17 -
 18
18 -
 19
19 -
 20
20 -
 21
21 -
 22
22 -
 23
23 -
 24
24 -
 25
25 -
 26
26 -
 27
27 -
 28
28 -
29
-
30
-
31
-
32
-
33
-
34
-
35
-
36
-
37
-
38
-
39
-
40
-
41
-
42
-
43
-
44
-
45
-
46
-
47
-
48
-
49
-
50
-
51
-
52
-
53
-
54
-
55
-
56
-
57
-
58
-
59
-
60
-
61
-
62
-
63
-
64
-
65
-
66
-
67
-
68
 |
 |

Form 10-K
http://www.sec.gov/Archives/edgar/data/949373/000119312509042707/d10k.htm[9/11/2014 10:10:56 AM]
Table of Contents
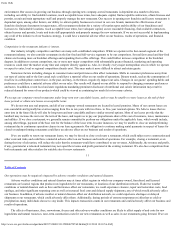
Performance Graph
The included performance graph covers the fiscal five-year period from December 30, 2003 through December 30, 2008. The graph
compares the total return of our common stock (BAGL) to our current peer group of companies (PGI) and the NASDAQ Composite Index. The
PGI was selected representing our competitive peer group, comprised of multi-concept companies and/or companies with a similar organizational
structure. The companies selected are participants of the restaurant industry with a sufficient period of operating history for continuous inclusion in
the Index.
Measurement period - five years (1) (2)
Fiscal
2003
Fiscal
2004
Fiscal
2005
Fiscal
2006
Fiscal
2007
Fiscal
2008
BAGL $ 100.00 $ 67.14 $ 128.57 $ 214.29 $ 518.57 $ 152.57
PGI (3) $ 100.00 $ 136.92 $ 150.20 $ 171.12 $ 128.05 $ 104.01
NASDAQ $ 100.00 $ 108.32 $ 111.64 $ 120.17 $ 131.96 $ 77.15
(1) Assumes all distributions to stockholders are reinvested on the payment dates.
(2) Assumes $100 initial investment on December 30, 2003 in BAGL, the PGI, and the NASDAQ Composite Index.
(3) The PGI is a price-weighted index. The index includes:
• Panera Bread Company
• Starbucks Corporation
• Sonic Corporation
• Jack in the Box Incorporated
• CKE Restaurants Incorporated (Hardee’ s, Carl’ s Jr., La Salsa, and Green Burrito restaurant chains)
• AFC Enterprises Incorporated (Popeyes Chicken and Biscuits restaurant chain)
• YUM! Brands, Incorporated (A&W, KFC, Long John Silver’ s, Pizza Hut and Taco Bell restaurant chains)
• Wendy’ s
22
Table of Contents
ITEM 6. SELECTED FINANCIAL DATA