Dunkin' Donuts 2013 Annual Report Download - page 5
Download and view the complete annual report
Please find page 5 of the 2013 Dunkin' Donuts annual report below. You can navigate through the pages in the report by either clicking on the pages listed below, or by using the keyword search tool below to find specific information within the annual report.-
 1
1 -
 2
2 -
 3
3 -
 4
4 -
 5
5 -
 6
6 -
 7
7 -
 8
8 -
 9
9 -
 10
10 -
 11
11 -
 12
12 -
 13
13 -
 14
14 -
 15
15 -
 16
16 -
17
-
18
-
19
-
20
-
21
-
22
-
23
-
24
-
25
-
26
-
27
-
28
-
29
-
30
-
31
-
32
-
33
-
34
-
35
-
36
-
37
-
38
-
39
-
40
-
41
-
42
-
43
-
44
-
45
-
46
-
47
-
48
-
49
-
50
-
51
-
52
-
53
-
54
-
55
-
56
-
57
-
58
-
59
-
60
-
61
-
62
-
63
-
64
-
65
-
66
-
67
-
68
-
69
-
70
-
71
-
72
-
73
-
74
-
75
-
76
-
77
-
78
-
79
-
80
-
81
-
82
-
83
-
84
-
85
-
86
-
87
-
88
-
89
-
90
-
91
-
92
-
93
-
94
-
95
-
96
-
97
-
98
-
99
-
100
-
101
-
102
-
103
-
104
-
105
-
106
-
107
-
108
-
109
-
110
-
111
-
112
-
113
-
114
-
115
-
116
 |
 |

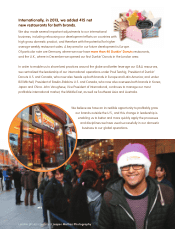
During our IPO roadshow, we said that our goal was to stabilize Baskin-Robbins in the U.S.
Since that time, the business has not only stabilized, it’s now growing. Baskin-Robbins U.S.
had positive net development in 2013 for the fi rst time since 2006.
Additionally, 2013 was the third straight year of
positive comps for the Baskin U.S. brand,
and similar to Dunkin’ Donuts U.S.,
Baskin-Robbins’ guest satisfaction
scores are showing strong and
continued improvement.
Baskin-Robbins U.S. also had an outstanding year.