Dunkin' Donuts 2011 Annual Report Download - page 13
Download and view the complete annual report
Please find page 13 of the 2011 Dunkin' Donuts annual report below. You can navigate through the pages in the report by either clicking on the pages listed below, or by using the keyword search tool below to find specific information within the annual report.-
 1
1 -
2
-
 3
3 -
 4
4 -
 5
5 -
 6
6 -
 7
7 -
 8
8 -
 9
9 -
 10
10 -
 11
11 -
 12
12 -
 13
13 -
 14
14 -
 15
15 -
 16
16 -
 17
17 -
 18
18 -
 19
19 -
 20
20 -
 21
21 -
 22
22 -
 23
23 -
24
-
25
-
26
-
27
-
28
-
29
-
30
-
31
-
32
-
33
-
34
-
35
-
36
-
37
-
38
-
39
-
40
-
41
-
42
-
43
-
44
-
45
-
46
-
47
-
48
-
49
-
50
-
51
-
52
-
53
-
54
-
55
-
56
-
57
-
58
-
59
-
60
-
61
-
62
-
63
-
64
-
65
-
66
-
67
-
68
-
69
-
70
-
71
-
72
-
73
-
74
-
75
-
76
-
77
-
78
-
79
-
80
-
81
-
82
-
83
-
84
-
85
-
86
-
87
-
88
-
89
-
90
-
91
-
92
-
93
-
94
-
95
-
96
-
97
-
98
-
99
-
100
-
101
-
102
-
103
-
104
-
105
-
106
-
107
-
108
-
109
-
110
-
111
-
112
-
113
-
114
-
115
-
116
-
117
-
118
-
119
-
120
-
121
-
122
-
123
-
124
-
125
-
126
-
127
 |
 |

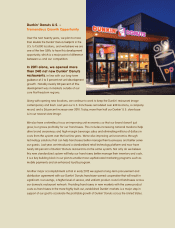
distribution in the U.S. Based on the commitments we have secured or expect to secure, we anticipate the
opening of approximately 260 to 280 net new points of distribution in the U.S. in 2012. Consistent with our
overall points of distribution mix, we expect that approximately 75% of our Dunkin’ Donuts openings in the U.S.
will be traditional format restaurants; however, this percentage may be higher or lower in any given year as a
result of specific development initiatives or other factors.
We believe our strong store-level economics and our track record of performance through economic cycles have
resulted in a diverse and stable franchisee base, in which the largest franchisee in the U.S. owns no more than
3.6% of the U.S. Dunkin’ Donuts points of distribution and domestic franchisees operate, on average, 6.1 points
of distribution in the U.S. Similarly, no Baskin-Robbins franchisee in the U.S. owns more than 1.0% of the U.S.
Baskin-Robbins points of distribution, and domestic franchisees operate, on average, 1.8 points of distribution in
the U.S.
Highly experienced management team
Our senior management team has significant QSR, foodservice and franchise company experience. Prior to
joining Dunkin’ Brands, our CEO Nigel Travis served as the CEO of Papa John’s International Inc. and
previously held numerous senior positions at Blockbuster Inc. and Burger King Corporation. John Costello, our
Chief Global Marketing & Innovation Officer, joined Dunkin’ Brands in 2009 having previously held leadership
roles at The Home Depot, Sears, Yahoo!, Nielsen Marketing Research and Procter & Gamble. Paul Twohig, our
Dunkin’ Donuts U.S. Chief Operating Officer, joined in October 2009 having previously held senior positions at
Starbucks Corporation and Panera Bread Company. Our CFO Neil Moses joined in November 2010, having
previously held numerous senior positions with public companies, including, most recently, CFO of Parametric
Technology Corporation. Giorgio Minardi, our President of International, joined Dunkin’ Brands in February
2012 having previously held senior leadership positions at the Autogrill Group, McDonald’s Corporation and
Burger King Corporation.
Our growth strategy
We believe there are significant opportunities to grow our brands globally, further support the profitability of our
franchisees, expand our leadership in the coffee, baked goods and ice cream categories of the QSR segment of
the restaurant industry, and deliver shareholder value by executing on the following strategies:
Increase comparable store sales and profitability in Dunkin’ Donuts U.S.
Our largest operating segment, Dunkin’ Donuts U.S., has experienced positive comparable store sales growth in
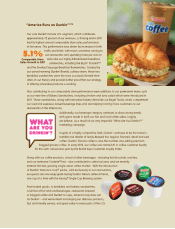
eight of the last ten fiscal years. We ended fiscal year 2011 with comparable store sales growth of 5.1%, which
was our highest annual comparable store sales growth since 2005, and 7.4% for the fourth quarter of 2011, which
was our highest quarterly performance in the past seven years. We intend to continue building on our comparable
store sales growth momentum and improve profitability through the following initiatives:
Further increase coffee and beverage sales. Since the late 1980s, we have transformed Dunkin’ Donuts into a
coffee-focused brand and have developed a significantly enhanced menu of beverage products, including
Coolattas®, espressos, iced lattes and flavored coffees. Approximately 60% of Dunkin’ Donuts U.S. franchisee-
reported sales for fiscal 2011 were generated from coffee and other beverages, which we believe generate
increased customer visits to our stores and higher unit volumes, and which produce higher margins than our other
products. We plan to increase our coffee and beverage revenue through continued new product innovations and
related marketing, including advertising campaigns such as “America Runs on Dunkin’” and “What are you
Drinkin’?”
In the summer of 2011, Dunkin’ Donuts began offering 14-count boxes of authentic Dunkin’ Donuts coffee in
Keurig®K-Cups, exclusively sold at participating Dunkin’ Donuts restaurants across the U.S. Using coffee
sourced and roasted to Dunkin’ Donuts’ exacting specifications, Dunkin’ K-Cup portion packs are available in
-3-