DuPont 2012 Annual Report Download - page 17
Download and view the complete annual report
Please find page 17 of the 2012 DuPont annual report below. You can navigate through the pages in the report by either clicking on the pages listed below, or by using the keyword search tool below to find specific information within the annual report.
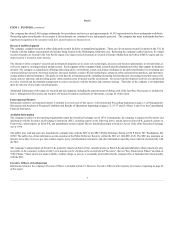
(Dollars in millions, except per share)
Net sales $34,812 $ 33,681 $ 27,700 $22,681 $26,169
Employee separation / asset related charges, net $493 $ 53 $ (40) $ 195 $331
Income from continuing operations before income taxes $3,115 $ 3,781 $ 3,260 $ 1,943 $ 2,388
Provision for income taxes on continuing operations $622 $626 $515 $ 326 $ 368
Net income attributable to DuPont $2,788 $3,474 $3,031 $1,755 $2,007
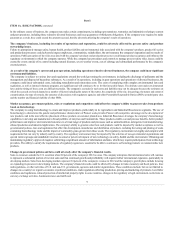
Basic earnings per share of common stock from continuing operations $ 2.63 $ 3.35 $2.99 $1.76 $ 2.22
Diluted earnings per share of common stock from continuing operations $2.61 $3.30 $ 2.94 $ 1.75 $ 2.21
Working capital2$7,642 $6,873 $9,670 $7,898 $5,601
Total assets3$49,736 $ 48,492 $ 40,410 $38,185 $36,209
Borrowings and capital lease obligations
Short-term $1,275 $ 817 $ 133 $1,506 $ 2,012
Long-term $10,465 $11,736 $10,137 $9,528 $7,638
Total equity $10,179 $9,062 $ 9,743 $ 7,651 $7,552
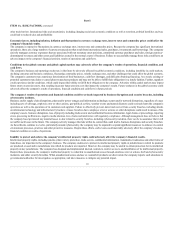
For the year
Purchases of property, plant & equipment and investments in
affiliates $1,890 $1,910 $1,608 $1,432 $2,033
Depreciation $1,319 $1,199 $1,118 $1,144 $967
Research and development expense $2,067 $1,910 $ 1,603 $ 1,324 $1,326
Average number of common shares outstanding (millions)
Basic 933 928 909 904 902
Diluted 942 941 922 909 907
Dividends per common share $1.70 $ 1.64 $ 1.64 $ 1.64 $ 1.64
At year-end
Employees (thousands) 70 70 60 58 60
Closing stock price $44.98 $ 45.78 $ 49.88 $ 33.67 $25.30
Common stockholders of record (thousands) 74 78 81 85 88
1. Information has been restated to reflect the impact of discontinued operations, as applicable. See Note 1, Basis of Presentation, to the Consolidated Financial Statements for further
information.
2. At December 31, 2012, working capital includes approximately $2.0 billion of net assets related to the Performance Coatings business, of which approximately $1.3 billion was
previously considered to be noncurrent and is now classified as held for sale. See Note 2 to the Consolidated Financial Statements for further information.
3. During 2011, the company acquired approximately $8.8 billion of assets in connection with the Danisco acquisition. See Note 4 to the Consolidated Financial Statements for further
information.
16


