Dollar General 2015 Annual Report Download - page 108
Download and view the complete annual report
Please find page 108 of the 2015 Dollar General annual report below. You can navigate through the pages in the report by either clicking on the pages listed below, or by using the keyword search tool below to find specific information within the annual report.-
 1
1 -
2
-
3
-
4
-
5
-
6
-
7
-
8
-
9
-
10
-
11
-
12
-
13
-
14
-
15
-
16
-
17
-
18
-
19
-
20
-
21
-
22
-
23
-
24
-
25
-
26
-
27
-
28
-
29
-
30
-
31
-
32
-
33
-
34
-
35
-
36
-
37
-
38
-
39
-
40
-
41
-
42
-
43
-
44
-
45
-
46
-
47
-
48
-
49
-
50
-
51
-
52
-
53
-
54
-
55
-
56
-
57
-
58
-
59
-
60
-
61
-
62
-
63
-
64
-
65
-
66
-
67
-
68
-
69
-
70
-
71
-
72
-
73
-
74
-
75
-
76
-
77
-
78
-
79
-
80
-
81
-
82
-
83
-
84
-
85
-
86
-
87
-
88
-
89
-
90
-
91
-
92
-
93
-
94
-
95
-
96
-
97
-
 98
98 -
 99
99 -
 100
100 -
 101
101 -
 102
102 -
 103
103 -
 104
104 -
 105
105 -
 106
106 -
 107
107 -
 108
108 -
 109
109 -
 110
110 -
 111
111 -
 112
112 -
 113
113 -
 114
114 -
 115
115 -
 116
116 -
 117
117 -
 118
118 -
119
-
120
-
121
-
122
-
123
-
124
-
125
-
126
-
127
-
128
-
129
-
130
-
131
-
132
-
133
-
134
-
135
-
136
-
137
-
138
-
139
-
140
-
141
-
142
-
143
-
144
-
145
-
146
-
147
-
148
-
149
-
150
-
151
-
152
-
153
-
154
-
155
-
156
-
157
-
158
-
159
-
160
-
161
-
162
-
163
-
164
-
165
-
166
-
167
-
168
 |
 |

10-K
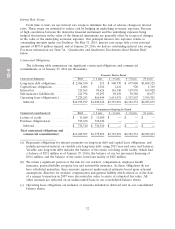
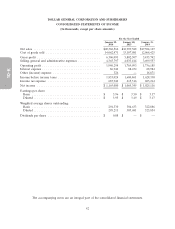
Cash flows from operating activities were $1.31 billion in 2014, an increase of $101.7 million
compared to 2013. Significant components of the increase in cash flows from operating activities in
2014 compared to 2013 include increased net income due primarily to increased sales and operating
profit in 2014 as described in more detail above under ‘‘Results of Operations.’’ Merchandise
inventories increased by a greater amount in 2014 compared to 2013 as described in greater detail
below, which was partially offset by accounts payable, which increased by $97.2 million in 2014
compared to a $36.9 million increase in 2013. The increase in accounts payable during 2014 was due
primarily to the volume and timing of domestic merchandise receipts.
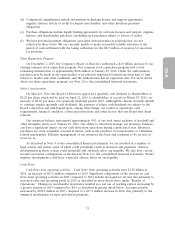
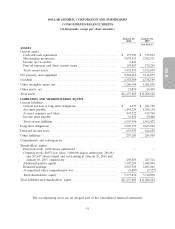
On an ongoing basis, we closely monitor and manage our inventory balances, and they may
fluctuate from period to period based on new store openings, the timing of purchases, and other
factors. Inventory balances at January 29, 2016 were impacted by a new DC in Texas, the timing of the
Easter holiday in 2016, and our in-stock improvement initiative. Merchandise inventories increased by
10% in 2015, by 9% in 2014, and by 7% in 2013. Inventory levels in the consumables category
increased by $218.4 million, or 13% in 2015, by $178.4 million, or 12%, in 2014, and by $168.0 million,
or 12%, in 2013. The seasonal category increased by $63.2 million, or 13%, in 2015, by $13.8 million, or
3%, in 2014, and decreased by $4.7 million, or 1%, in 2013. The home products category increased by
$12.8 million, or 5%, in 2015, was essentially unchanged in 2014, and increased by $22.0 million, or 9%,
in 2013. The apparel category decreased by $2.7 million, or 1%, in 2015, increased by $37.1 million, or
13%, in 2014, and decreased by $29.5 million, or 9%, in 2013.
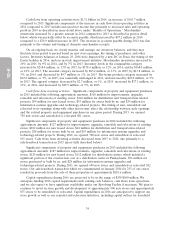
Cash flows from investing activities. Significant components of property and equipment purchases
in 2015 included the following approximate amounts: $168 million for improvements, upgrades,
remodels and relocations of existing stores; $144 million for distribution and transportation-related
projects; $99 million for new leased stores; $53 million for stores built by us; and $34 million for
information systems upgrades and technology-related projects. The timing of new, remodeled and
relocated store openings along with other factors may affect the relationship between such openings
and the related property and equipment purchases in any given period. During 2015, we opened
730 new stores and remodeled or relocated 881 stores.
Significant components of property and equipment purchases in 2014 included the following
approximate amounts: $127 million for improvements, upgrades, remodels and relocations of existing
stores; $102 million for new leased stores; $64 million for distribution and transportation-related
projects; $38 million for stores built by us; and $35 million for information systems upgrades and
technology-related projects. During 2014, we opened 700 new stores and remodeled or relocated
915 stores. Cash flows from investing activities decreased from 2013 to 2014, due primarily to a
sale-leaseback transaction in 2013 (more fully described below).
Significant components of property and equipment purchases in 2013 included the following
approximate amounts: $187 million for improvements, upgrades, remodels and relocations of existing
stores; $124 million for new leased stores; $112 million for distribution centers, which included a
significant portion of the construction cost of a distribution center in Pennsylvania; $76 million for
stores purchased or built by us; and $28 million for information systems upgrades and
technology-related projects. During 2013, we opened 650 new stores and remodeled or relocated 582
stores. Our sale-leaseback transaction which we consummated in January 2014 for 233 of our stores
resulted in proceeds from the sale of these properties of approximately $281.6 million.
Capital expenditures during 2016 are projected to be in the range of $550-$600 million. We
anticipate funding 2016 capital requirements with existing cash balances, cash flows from operations,
and we also expect to have significant availability under our Revolving Facility if necessary. We plan to
continue to invest in store growth and development of approximately 900 new stores and approximately
875 stores to be remodeled or relocated. Capital expenditures in 2016 are anticipated to support our
store growth as well as our remodel and relocation initiatives, including capital outlays for leasehold
34