Delta Airlines 2012 Annual Report Download - page 52
Download and view the complete annual report
Please find page 52 of the 2012 Delta Airlines annual report below. You can navigate through the pages in the report by either clicking on the pages listed below, or by using the keyword search tool below to find specific information within the annual report.-
 1
1 -
2
-
3
-
4
-
5
-
6
-
7
-
8
-
9
-
10
-
11
-
12
-
13
-
14
-
15
-
16
-
17
-
18
-
19
-
20
-
21
-
22
-
23
-
24
-
25
-
26
-
27
-
28
-
29
-
30
-
31
-
32
-
33
-
34
-
35
-
36
-
37
-
38
-
39
-
40
-
41
-
 42
42 -
 43
43 -
 44
44 -
 45
45 -
 46
46 -
 47
47 -
 48
48 -
 49
49 -
 50
50 -
 51
51 -
 52
52 -
 53
53 -
 54
54 -
 55
55 -
 56
56 -
 57
57 -
 58
58 -
 59
59 -
 60
60 -
 61
61 -
 62
62 -
63
-
64
-
65
-
66
-
67
-
68
-
69
-
70
-
71
-
72
-
73
-
74
-
75
-
76
-
77
-
78
-
79
-
80
-
81
-
82
-
83
-
84
-
85
-
86
-
87
-
88
-
89
-
90
-
91
-
92
-
93
-
94
-
95
-
96
-
97
-
98
-
99
-
100
-
101
-
102
-
103
-
104
-
105
-
106
-
107
-
108
-
109
-
110
-
111
-
112
-
113
-
114
-
115
-
116
-
117
-
118
-
119
-
120
-
121
-
122
-
123
-
124
-
125
-
126
-
127
-
128
-
129
-
130
-
131
-
132
-
133
-
134
-
135
-
136
-
137
-
138
-
139
-
140
-
141
-
142
-
143
-
144
-
145
-
146
-
147
-
148
-
149
-
150
-
151
-
152
-
153
-
154
-
155
-
156
-
157
-
158
-
159
-
160
-
161
-
162
-
163
-
164
-
165
-
166
-
167
-
168
-
169
-
170
-
171
-
172
-
173
-
174
-
175
-
176
-
177
-
178
-
179
-
180
-
181
-
182
-
183
-
184
-
185
-
186
-
187
-
188
-
189
-
190
-
191
-
192
-
193
-
194
-
195
-
196
-
197
-
198
-
199
-
200
-
201
-
202
-
203
-
204
-
205
-
206
-
207
-
208
-
209
-
210
-
211
-
212
-
213
-
214
-
215
-
216
-
217
-
218
-
219
-
220
-
221
-
222
-
223
-
224
-
225
-
226
-
227
-
228
-
229
-
230
-
231
-
232
-
233
-
234
-
235
-
236
-
237
-
238
-
239
-
240
-
241
-
242
-
243
-
244
-
245
-
246
-
247
-
248
-
249
-
250
-
251
-
252
-
253
-
254
-
255
-
256
-
257
-
258
-
259
-
260
-
261
-
262
-
263
-
264
-
265
-
266
-
267
-
268
-
269
-
270
-
271
-
272
-
273
-
274
-
275
-
276
-
277
-
278
-
279
-
280
-
281
-
282
-
283
-
284
-
285
-
286
-
287
-
288
-
289
-
290
-
291
-
292
-
293
-
294
-
295
-
296
-
297
-
298
-
299
-
300
-
301
-
302
-
303
-
304
-
305
-
306
-
307
-
308
-
309
-
310
-
311
-
312
-
313
-
314
-
315
-
316
-
317
-
318
-
319
-
320
-
321
-
322
-
323
-
324
-
325
-
326
-
327
-
328
-
329
-
330
-
331
-
332
-
333
-
334
-
335
-
336
-
337
-
338
-
339
-
340
-
341
-
342
-
343
-
344
-
345
-
346
-
347
-
348
-
349
-
350
-
351
-
352
-
353
-
354
-
355
-
356
-
357
-
358
-
359
-
360
-
361
-
362
-
363
-
364
-
365
-
366
-
367
-
368
-
369
-
370
-
371
-
372
-
373
-
374
-
375
-
376
-
377
-
378
-
379
-
380
-
381
-
382
-
383
-
384
-
385
-
386
-
387
-
388
-
389
-
390
-
391
-
392
-
393
-
394
-
395
-
396
-
397
-
398
-
399
-
400
-
401
-
402
-
403
-
404
-
405
-
406
-
407
-
408
-
409
-
410
-
411
-
412
-
413
-
414
-
415
-
416
-
417
-
418
-
419
-
420
-
421
-
422
-
423
-
424
 |
 |

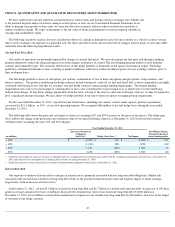
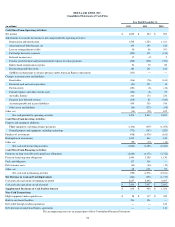
ITEM 7A. QUANTITATIVE AND QUALITATIVE DISCLOSURES ABOUT MARKET RISK
We have market risk exposure related to aircraft fuel prices, interest rates and foreign currency exchange rates. Market risk
is the potential negative impact of adverse changes in these prices or rates on our Consolidated Financial Statements. In an
effort to manage our exposure to these risks, we enter into derivative contracts and may adjust our derivative portfolio as
market conditions change. We expect adjustments to the fair value of financial instruments to result in ongoing volatility in
earnings and stockholders' equity.
The following sensitivity analysis does not consider the effects of a change in demand for air travel, the economy as a whole or actions we may
take to seek to mitigate our exposure to a particular risk. For these and other reasons, the actual results of changes in these prices or rates may differ
materially from the following hypothetical results.
Aircraft Fuel Price Risk
Our results of operations are materially impacted by changes in aircraft fuel prices. We actively manage our fuel price risk through a hedging
program intended to reduce the financial impact on us from changes in the price of jet fuel. This fuel hedging program utilizes several different
contract and commodity types. The economic effectiveness of this hedge portfolio is frequently tested against our financial targets. The hedge
portfolio is rebalanced from time to time according to market conditions, which may result in locking in gains or losses on hedge contracts prior to
their settlement dates .
Our fuel hedge portfolio consists of call options; put options; combinations of two or more call options and put options; swap contracts; and
futures contracts.
The products underlying the hedge contracts include heating oil, crude oil, jet fuel and diesel fuel, as these commodities are highly
correlated with the price of jet fuel that we consume. Our fuel hedge contracts contain margin funding requirements. The margin funding
requirements may cause us to post margin to counterparties or may cause counterparties to post margin to us as market prices in the underlying
hedged items change.
If fuel prices change significantly from the levels existing at the time we enter into fuel hedge contracts, we may be required to
post a significant amount of margin. We may adjust our hedge portfolio from time to time in response to margin posting requirements.
For the year ended December 31, 2012 , aircraft fuel and related taxes, including our contract carriers under capacity purchase agreements,
accounted for $12.3 billion , or 36% , of our total operating expense. We recognized $66 million of net fuel hedge losses during the year ended
December 31, 2012 .
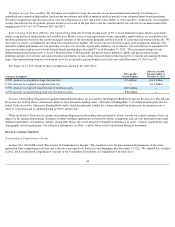
The following table shows the projected cash impact to fuel cost assuming 10% and 20% increases or decreases in fuel prices. The hedge gain
(loss) reflects the change in the projected cash settlement value of our open fuel hedge contracts at December 31, 2012 based on their contract
settlement dates, assuming the same 10% and 20% changes.
Interest Rate Risk
Our exposure to market risk from adverse changes in interest rates is primarily associated with our long-term debt obligations. Market risk
associated with our fixed and variable rate long-term debt relates to the potential reduction in fair value and negative impact to future earnings,
respectively, from an increase in interest rates.
At December 31, 2012 , we had $5.9 billion of fixed-rate long-term debt and $6.7 billion of variable-rate long-term debt. An increase of 100 basis
points in average annual interest rates would have decreased the estimated fair value of our fixed-rate long-term debt by $260 million at
December 31, 2012 and would have increased the annual interest expense on our variable-rate long-
term debt by $40 million, exclusive of the impact
of our interest rate hedge contracts.
47
Year Ending December 31, 2013
Fuel Hedge Margin
(Posted to) Received
from Counterparties (in millions)
(Increase) Decrease to
Unhedged
Fuel Cost
(1)
Hedge Gain (Loss)
(2)
Net Impact
+ 20%
$
(2,250
)
$
170
$
(2,080
)
$
130
+ 10%
(1,120
)
200
(920
)
140
- 10%
1,120
(120
)
1,000
70
- 20%
2,250
(290
)
1,960
80
(1)
Projections based upon the (increase) decrease to unhedged fuel cost as compared to the jet fuel price per gallon of $3.01, excluding transportation costs and taxes, at December 31,
2012 and estimated fuel consumption of 3.8 billion gallons for the year ending December 31, 2013.
(2)
Projections based on average futures prices by contract settlement month compared to futures prices at December 31, 2012
.