Delta Airlines 2011 Annual Report Download - page 127
Download and view the complete annual report
Please find page 127 of the 2011 Delta Airlines annual report below. You can navigate through the pages in the report by either clicking on the pages listed below, or by using the keyword search tool below to find specific information within the annual report.-
 1
1 -
2
-
3
-
4
-
5
-
6
-
7
-
8
-
9
-
10
-
11
-
12
-
13
-
14
-
15
-
16
-
17
-
18
-
19
-
20
-
21
-
22
-
23
-
24
-
25
-
26
-
27
-
28
-
29
-
30
-
31
-
32
-
33
-
34
-
35
-
36
-
37
-
38
-
39
-
40
-
41
-
42
-
43
-
44
-
45
-
46
-
47
-
48
-
49
-
50
-
51
-
52
-
53
-
54
-
55
-
56
-
57
-
58
-
59
-
60
-
61
-
62
-
63
-
64
-
65
-
66
-
67
-
68
-
69
-
70
-
71
-
72
-
73
-
74
-
75
-
76
-
77
-
78
-
79
-
80
-
81
-
82
-
83
-
84
-
85
-
86
-
87
-
88
-
89
-
90
-
91
-
92
-
93
-
94
-
95
-
96
-
97
-
98
-
99
-
100
-
101
-
102
-
103
-
104
-
105
-
106
-
107
-
108
-
109
-
110
-
111
-
112
-
113
-
114
-
115
-
116
-
 117
117 -
 118
118 -
 119
119 -
 120
120 -
 121
121 -
 122
122 -
 123
123 -
 124
124 -
 125
125 -
 126
126 -
 127
127 -
 128
128 -
 129
129 -
 130
130 -
 131
131 -
 132
132 -
 133
133 -
 134
134 -
 135
135 -
 136
136 -
 137
137 -
138
-
139
-
140
-
141
-
142
-
143
-
144
 |
 |
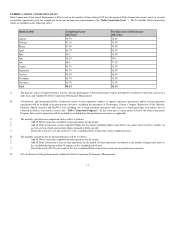
EXHIBIT A- DELTA CONNECTION GOALS:
Delta Connection's Operational Performance will be based on the number of times during 2012 that the group of Delta Connection carriers meets or exceeds
its monthly operational goals for completion factor and on-time arrival performance (the “Delta Connection Goals ”). The 24 monthly Delta Connection
Goals are included on the following tables:
Month in 2012 Completion Factor
2012 Goal On-Time Arrival Performance
2012 Goal
January 96.7% 78.2%
February 97.1% 79.3%
March 97.9% 79.8%
April 98.7% 84.1%
May 99% 84.5%
June 98.1% 78%
July 98% 77.3%
August 98.3% 81.1%
September 98.7% 86.1%
October 98.6% 86.4%
November 98.7% 85.2%
December 96.7% 72.2%
Total 98.1% 81.1%
A. The primary source of reported metrics used to calculate performance will be performance reports provided by each Delta Connection carrier on a
daily basis and validated by Delta Connection Performance Management.
B. All domestic and international Delta Connection carrier system operations subject to capacity purchase agreements and/or revenue proration
agreements will be included in the performance measures, including the operations of Chautauqua, Comair, Compass, ExpressJet, GoJet, Mesaba,
Pinnacle, Shuttle America and SkyWest, but excluding any revenue proration operations with respect to which passenger reservations are not
reflected on Delta's reservations system (the “ Delta Connection Program”). In the event that a carrier enters or leaves the Delta Connection
Program, that carrier's operations will be included or excluded from the performance measures as applicable.
C. The monthly calculation for completion factor will be as follows:
1. Add all Delta Connection scheduled system operations for the month.
2. Add all Delta Connection system completed flights for the month (including flights canceled by one carrier and covered by another via
an extra section, which also includes flights changed to Delta aircraft).
3. Divide the result of C.2 by the result of C.1 for a combined Delta Connection system completion factor.
D. The monthly calculation for on-time performance will be as follows:
1. Add all Delta Connection completed system operations for the month.
2. Add all Delta Connection system on time operations for the month. On time operations are defined as the number of flights that arrive at
the scheduled destination within 15 minutes of the scheduled arrival time.
3. Divide the result of D.2 by the result of D.1 for a combined Delta Connection system on-time performance measure.
E. All calculations will be performed and validated by Delta Connection Performance Management.
11