Dell 2004 Annual Report Download - page 48
Download and view the complete annual report
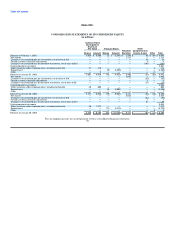
Please find page 48 of the 2004 Dell annual report below. You can navigate through the pages in the report by either clicking on the pages listed below, or by using the keyword search tool below to find specific information within the annual report.-
 1
1 -
2
-
3
-
4
-
5
-
6
-
7
-
8
-
9
-
10
-
11
-
12
-
13
-
14
-
15
-
16
-
17
-
18
-
19
-
20
-
21
-
22
-
23
-
24
-
25
-
26
-
27
-
28
-
29
-
30
-
31
-
32
-
33
-
34
-
35
-
36
-
37
-
 38
38 -
 39
39 -
 40
40 -
 41
41 -
 42
42 -
 43
43 -
 44
44 -
 45
45 -
 46
46 -
 47
47 -
 48
48 -
 49
49 -
 50
50 -
 51
51 -
 52
52 -
 53
53 -
 54
54 -
 55
55 -
 56
56 -
 57
57 -
 58
58 -
59
-
60
-
61
-
62
-
63
-
64
-
65
-
66
-
67
-
68
-
69
-
70
-
71
-
72
-
73
-
74
-
75
-
76
-
77
-
78
-
79
-
80
 |
 |

Table of Contents
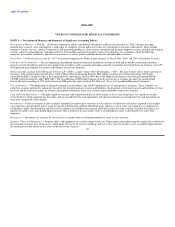
contracts has been estimated using market quoted rates of foreign currencies at the applicable balance sheet date. The estimated fair value of
foreign currency purchased option contracts is based on market quoted rates at the applicable balance sheet date and the Black-Scholes
option pricing model. The estimates presented herein are not necessarily indicative of the amounts that Dell could realize in a current market
exchange. Changes in assumptions could significantly affect the estimates.
Cash and cash equivalents, accounts receivable, accounts payable, and accrued and other liabilities are reflected in the accompanying
consolidated statement of financial position at cost, which approximates fair value because of the short-term maturity of these instruments.
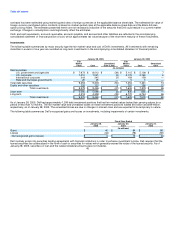
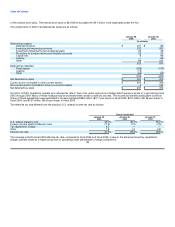
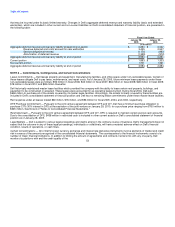
Investments
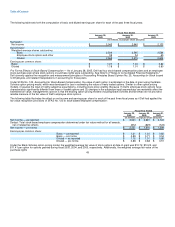
The following table summarizes by major security type the fair market value and cost of Dell's investments. All investments with remaining
maturities in excess of one year are recorded as long-term investments in the accompanying consolidated statement of financial position.
January 28, 2005 January 30, 2004
Fair Fair
Market Unrealized Market Unrealized
Value Cost Gain (Loss) Value Cost Gain
(in millions)
Debt securities:
U.S. government and agencies $ 7,973 $ 8,012 $ (39) $ 5,115 $ 5,108 $ 7
U.S. corporate 1,012 1,021 (9) 2,175 2,169 6
International corporate 243 245 (2) 159 159 —
State and municipal governments 25 25 — 5 5 —
Total debt securities 9,253 9,303 (50) 7,454 7,441 13
Equity and other securities 126 123 3 151 138 13
Total investments $ 9,379 $ 9,426 $ (47) $ 7,605 $ 7,579 $ 26
Short-term $ 5,060 $ 5,068 $ (8) $ 835 $ 835 $ —
Long-term 4,319 4,358 (39) 6,770 6,744 26
Total investments $ 9,379 $ 9,426 $ (47) $ 7,605 $ 7,579 $ 26
As of January 28, 2005, Dell had approximately 1,290 debt investment positions that had fair market values below their carrying values for a
period of less than 12 months. The fair market value and unrealized losses on these investment positions totaled $10 billion and $49 million,
respectively, as of January 28, 2005. The unrealized losses are due to changes in interest rates and are expected to be temporary in nature.
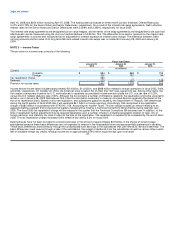
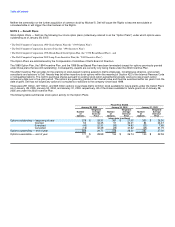
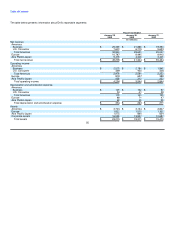
The following table summarizes Dell's recognized gains and losses on investments, including impairments of certain investments:
Fiscal Year Ended
January 28, January 30, January 31,
2005 2004 2003
(in millions)
Gains $ 40 $ 94 $ 86
Losses (34) (78) (92)
Net recognized gains (losses) $ 6 $ 16 $ (6)
Dell routinely enters into securities lending agreements with financial institutions in order to enhance investment income. Dell requires that the
loaned securities be collateralized in the form of cash or securities for values which generally exceed the value of the loaned security. As of
January 28, 2005, securities on loan and the related collateral amounts were not material.
45