D-Link 2003 Annual Report Download - page 5
Download and view the complete annual report
Please find page 5 of the 2003 D-Link annual report below. You can navigate through the pages in the report by either clicking on the pages listed below, or by using the keyword search tool below to find specific information within the annual report.-
 1
1 -
 2
2 -
 3
3 -
 4
4 -
 5
5 -
 6
6 -
 7
7 -
 8
8 -
 9
9 -
 10
10 -
 11
11 -
 12
12 -
 13
13 -
 14
14 -
 15
15 -
 16
16 -
17
-
18
-
19
-
20
-
21
-
22
-
23
-
24
-
25
 |
 |

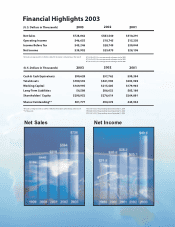
Net Sales Net Income
Financial Highlights 2003
Net Sales
Operating Income
Income Before Tax
Net Income
$728,062
$46,655
$45,246
$39,992
$583,560
$18,745
$28,749
$25,075
$510,291
$15,256
$30,044
$28,196
2003 2002 2001
(U.S. Dollars in Thousands)
*Amounts are expressed in U.S. Dollars solely for the readers convenience, at the rate of: NT$34.36=US$1, the average annual exchange rate for 2003
NT$34.62=US$1, the average annual exchange rate for 2002
NT$33.87=US$1, the average annual exchange rate for 2001
Cash & Cash Equivalents
Total Assets
Working Capital
Long-Term Liabilities
Shareholders’ Equity
Shares Outstanding**
$90,620
$700,592
$169,995
$6,580
$298,952
501,777
$57,762
$541,990
$215,405
$86,632
$276,619
494,378
$90,394
$503,998
$179,903
$85,160
$264,801
445,944
2003 2002 2001
(U.S. Dollars in Thousands)
*Amounts are expressed in U.S. Dollars solely for the readers convenience, at the rate of:
**In Thousands
NT$33.93=US$1, The prevailing rate on December 31, 2003
NT$34.62=US$1, The prevailing rate on December 31, 2002
NT$33.87=US$1, The prevailing rate on December 31, 2001