Creative 1999 Annual Report Download - page 13
Download and view the complete annual report
Please find page 13 of the 1999 Creative annual report below. You can navigate through the pages in the report by either clicking on the pages listed below, or by using the keyword search tool below to find specific information within the annual report.-
 1
1 -
2
-
 3
3 -
 4
4 -
 5
5 -
 6
6 -
 7
7 -
 8
8 -
 9
9 -
 10
10 -
 11
11 -
 12
12 -
 13
13 -
 14
14 -
 15
15 -
 16
16 -
 17
17 -
 18
18 -
 19
19 -
 20
20 -
 21
21 -
 22
22 -
 23
23 -
24
-
25
-
26
-
27
-
28
-
29
-
30
-
31
-
32
-
33
-
34
-
35
-
36
-
37
-
38
-
39
-
40
-
41
-
42
-
43
-
44
-
45
-
46
 |
 |

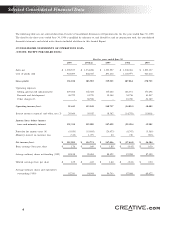
11
YEAR ENDED JUNE 30, 1998 COMPARED TO YEAR ENDED JUNE 30, 1997
Net sales in fiscal 1998 were flat, compared to fiscal 1997. During fiscal 1998, audio sales (Sound Blaster audio cards and chipsets) decreased
by 19%, compared to fiscal 1997, and represented 45% of total sales, compared to 56% in fiscal 1997. This decrease was primarily attributable
to declining average selling prices, a reduction in low-end audio product sales, and reduced sales to Asian customers due to the macro-
economic issues in that region. Sales of Multimedia Upgrade Kits (“MMUK”) increased by 4% in fiscal 1998 and represented 36% of
total sales, compared to fiscal 1997, when they represented 34% of total sales. The increase in MMUK sales was primarily attributable
to an increase in sales volume as well as a favorable MMUK component mix. MMUK sold in fiscal 1998 included speakers and higher
priced DVD drives, AWE64 and AWE64 Gold cards, compared with lower priced CD-ROM drives and Sound Blaster 16 or AWE32 audio
cards in MMUK sold in fiscal 1997. This increase in MMUK sales was partly offset by a decrease in sales experienced in the latter half
of fiscal 1998, compared with the same period in the prior fiscal year, due to declining average selling prices and a reduction of sales to
Asian customers. Sales of video and graphics products increased by 232% in fiscal 1998 and represented 8% of total sales, compared to
fiscal 1997, when they represented 2% of total sales. This increase was primarily attributable to the introduction of Graphics Blaster Exxtreme
and 3D Blaster Voodoo2 graphic accelerator cards in fiscal 1998. Sales of other products increased by 48% in fiscal 1998 due primarily
to an increase in speaker sales. Sales of other products represented 11% of total sales in fiscal 1998, compared to 8% of total sales in fiscal
1997.
Gross profit increased by 14% in fiscal 1998 and represented 31% of sales, compared to 28% in fiscal 1997. This improvement in profitability
was primarily attributable to a favorable product mix, resulting from increased sales of higher margin products such as speakers, AWE64
and AWE64 Gold cards, lower material component costs, and improved production efficiencies. In the fourth quarter of fiscal 1998 Creative’s
gross margin decreased to 26%, primarily due to an unfavorable product mix with a reduction in revenue from the higher margin audio
products and a decline in average selling prices of audio and graphic products. There can be no assurance that improvements in the overall
gross margin percentages experienced in fiscal 1998 will continue or that Creative can maintain such gross margin percentages in the future.
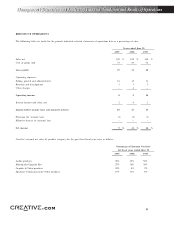
Selling, general and administrative expenses increased to 13% of sales in fiscal 1998, compared to 11% of sales in fiscal 1997. This increase
was primarily due to an increase in amortization of intangibles attributable to the new acquisitions in fiscal 1998 (see Note 14 of “Notes
to Consolidated Financial Statements”) and increased marketing and advertising expenses aimed at leveraging Creative’s brand image and
generating demand for its products. Research and development expenses in fiscal 1998 remained flat at 3% of sales, compared to the prior
year.
Included in the results of fiscal 1998 were other charges of $68.6 million. This related to three acquisitions recorded under the purchase
method of accounting, resulting in an aggregate write off of acquired in-process technology of $60.3 million (see Note 14 of “Notes to
Consolidated Financial Statements”) and a one-time charge of $8.3 million for the cessation of certain activities.
Included in the results of fiscal 1998 and 1997 were net gains from sale of investments of $18.5 million and $6.8 million, respectively. Net
interest and other income improved by $9.6 million in fiscal 1998, compared to the prior year, which was primarily attributable to an increase
in interest income earned from higher average cash balances in fiscal 1998.
In fiscal 1998, Creative’s effective tax rate increased from 10.7% in fiscal 1997 to 13%. Creative’s effective tax rate is based on the mix
of income arising from various geographical regions, where the tax rates range from 26% to 50%; pioneer status income in Singapore,
which is exempt from tax; and the utilization of non Singapore net operating losses. The pioneer status had the effect of reducing Creative’s
provision for income taxes by approximately $43.3 million or $0.46 per share and $36.4 million or $0.40 per share, for fiscal 1998 and
1997, respectively. The Pioneer Certificate will expire in the year 2000, subject to certain conditions. See Note 9 of “Notes to Consolidated
Financial Statements”.
Management’s Discussion and Analysis of Financial Condition and Results of Operations
Management’s Discussion and Analysis of Financial Condition and Results of Operations