Community Health Systems 2010 Annual Report Download - page 5
Download and view the complete annual report
Please find page 5 of the 2010 Community Health Systems annual report below. You can navigate through the pages in the report by either clicking on the pages listed below, or by using the keyword search tool below to find specific information within the annual report.-
 1
1 -
 2
2 -
 3
3 -
 4
4 -
 5
5 -
 6
6 -
 7
7 -
 8
8 -
 9
9 -
 10
10
 |
 |

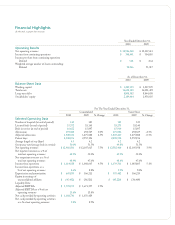
Year Ended December 31,
2010 2009
Operating Results
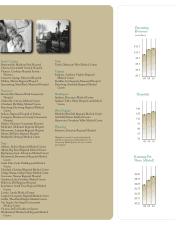
Net operating revenues $ 12,986,500 $ 12,107,613
Income from continuing operations $ 348,441 $ 304,805
Income per share from continuing operations
Diluted $ 3.01 $ 2.64
Weighted average number of shares outstanding:
Diluted 92,946 91,517
As of December 31,
2010 2009
Balance Sheet Data
Working capital $ 1,229,153 $ 1,217,199
Total assets 14,698,123 14,021,472
Long-term debt 8,808,382 8,844,638
Stockholders’ equity 2,189,464 1,950,635
For The Year Ended December 31,
Consolidated Same Store
2010 2009 % Change 2010 2009 % Change
Selected Operating Data
Number of hospitals (at end of period) 130 125 125 125
Licensed beds (at end of period) 19,372 18,140 18,273 18,140
Beds in service (at end of period) 16,622 15,897 15,914 15,897
Admissions 693,382 692,569 0.1% 675,086 692,569 -2.5%
Adjusted admissions 1,308,334 1,275,888 2.5% 1,269,467 1,275,888 -0.5%
Patient days 2,948,876 2,937,194 2,858,532 2,937,194
Average length of stay (days) 4.3 4.2 4.2 4.2
Occupancy rate (average beds in service) 50.0% 51.3% 49.8% 51.3%
Net operating revenues $ 12,986,500 $ 12,107,613 7.3% $ 12,582,406 $ 12,105,938 3.9%
Net inpatient revenues as a % of
total net operating revenues 48.9% 50.1% 49.3% 50.1%
Net outpatient revenues as a % of
total net operating revenues 48.9% 47.6% 48.6% 47.6%
Income from operations $ 1,114,928 $ 1,068,665 4.3% $ 1,139,501 $ 1,083,805 5.1%
Income from operations as a
% of net operating revenues 8.6% 8.8% 9.1% 9.0%
Depreciation and amortization $ 609,839 $ 566,211 $ 595,482 $ 566,219
Equity in earnings of
unconsolidated affiliates $ (45,432) $ (36,521) $ (45,220) $ (36,409)
Liquidity Data:
Adjusted EBITDA $ 1,770,199 $ 1,671,397 5.9%
Adjusted EBITDA as a % of net
operating revenues 13.6% 13.8%
Net cash provided by operating activities $ 1,188,730 $ 1,076,429
Net cash provided by operating activities
as a % of net operating revenues 9.2% 8.9%
Financial Highlights
(In thousands, except per share amounts)