Comfort Inn 2005 Annual Report Download - page 13
Download and view the complete annual report
Please find page 13 of the 2005 Comfort Inn annual report below. You can navigate through the pages in the report by either clicking on the pages listed below, or by using the keyword search tool below to find specific information within the annual report.-
 1
1 -
2
-
 3
3 -
 4
4 -
 5
5 -
 6
6 -
 7
7 -
 8
8 -
 9
9 -
 10
10 -
 11
11 -
 12
12 -
 13
13 -
 14
14 -
 15
15 -
 16
16 -
 17
17 -
 18
18 -
 19
19 -
 20
20 -
 21
21 -
 22
22 -
 23
23 -
24
-
25
-
26
-
27
-
28
-
29
-
30
-
31
-
32
-
33
-
34
-
35
-
36
-
37
-
38
-
39
-
40
-
41
-
42
-
43
-
44
-
45
-
46
-
47
-
48
-
49
-
50
-
51
-
52
-
53
-
54
-
55
-
56
-
57
-
58
-
59
 |
 |
systems, quality assurance standards and endorsed vendor relationships. We believe that healthy brands, which
deliver a compelling return on investment for franchisees, will enable us to sell additional hotel franchises and
raise royalty rates. We have established multiple brands that meet the needs of many types of guests, and can be
developed at various price points and applied to both new and existing hotels. This ensures that we have brands
suitable for creating growth in a variety of market conditions. Improving the performance of the hotels under
franchise, growing the system through additional franchise sales and improving franchise agreement pricing
while maintaining a disciplined cost structure are the keys to profitable growth.
Maximizing Financial Returns and Creating Value for Shareholders. Our capital allocation decisions,
including capital structure and uses of capital, are intended to maximize our return on invested capital and create
value for our shareholders. We believe our strong and predictable cash flows create a strong financial position
that provides us a competitive advantage. Our business does not require significant capital to operate and grow,
therefore, we can maintain a capital structure that generates high financial returns and use our excess cash flow to
increase returns to our shareholders. We have returned value to our shareholders in two primary ways: share
repurchases and dividends. In 1998, we instituted a share repurchase program which has generated substantial
value for our shareholders. We have repurchased 33.6 million shares (including 33.0 million prior to the 2 for 1
stock split effected in October 2005) of common stock at a total cost of $711.9 million, or an average price of
$21.16 per share since the program’s inception. On December 8, 2005, the board of directors authorized a
3 million share increase in the number of shares available for repurchase under the program. Our cash flows from
operations support our ability to complete the repurchase of approximately 5.1 million shares presently
remaining under our current board of directors’ authorization. The Company expects to continue to return value
to its shareholders through a combination of dividends and share repurchases, subject to market and other
conditions and upon completion of the current authorization we will evaluate the propriety of additional share
repurchases with our board of directors. During 2005, we paid cash dividends totaling approximately $30.2
million and we presently expect to continue to pay dividends in the future. Based on our present dividend rate
and outstanding share count, aggregate annual dividends would be approximately $33.8 million.
We believe these value drivers, when properly implemented, will enhance our profitability, maximize our
financial returns and continue to generate value for our shareholders. The ultimate measure of our success will be
reflected in the items below.
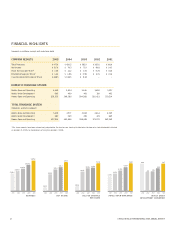
Results of Operation: Royalty fees, operating income, net income and diluted earnings per share (“EPS”)
represent key measurements of these value drivers. In 2005, royalty fees revenue totaled approximately $187.3
million, a 12% increase from 2004. Operating income totaled $143.8 million for the year ended December 31,
2005, a 15% increase from 2004. Net income for the year ended December 31, 2005 increased to $87.6 million,
an increase of $13.2 million over the year ended December 31, 2004, an 18% increase. Diluted earnings per share
were $1.32, a 22% improvement over 2004 resulting from increased net income and a reduction in the number of
shares outstanding attributable to our share repurchase program. Net income and diluted earnings per share in
2005 included additional income tax expense of approximately $1.2 million related to the Company’s
repatriation of foreign earnings pursuant to the American Jobs Creation Act and a reduction of income tax
expense related to the resolution of certain tax contingencies of approximately $4.9 million. Those items
represent diluted EPS of $0.06, net, for the year ended December 31, 2005. Net income and diluted earnings per
share in 2004 include a loss on extinguishment of debt of approximately $0.7 million ($0.4 million, net of the
related tax effect) related to the refinancing of the Company’s senior credit facility and a reduction of income tax
expense related to the resolution of certain tax contingencies of approximately $1.2 million. Those items
represented diluted EPS of $0.01 per share, net, for the year ended December 31, 2004. These measurements will
continue to be a key management focus in 2006 and beyond.
Refer to MD&A heading “Operations Review” for additional analysis of our results.
Liquidity and Capital Resources: The Company generates significant cash flows from operations.In 2005
and 2004, net cash provided by operating activities was $132.9 million and $108.1 million, respectively. Since
11