Comerica 2012 Annual Report Download - page 3
Download and view the complete annual report
Please find page 3 of the 2012 Comerica annual report below. You can navigate through the pages in the report by either clicking on the pages listed below, or by using the keyword search tool below to find specific information within the annual report.-
 1
1 -
 2
2 -
 3
3 -
 4
4 -
 5
5 -
 6
6 -
 7
7 -
 8
8 -
 9
9 -
 10
10 -
 11
11 -
 12
12 -
 13
13 -
 14
14 -
15
-
16
-
17
-
18
-
19
-
20
-
21
-
22
-
23
-
24
-
25
-
26
-
27
-
28
-
29
-
30
-
31
-
32
-
33
-
34
-
35
-
36
-
37
-
38
-
39
-
40
-
41
-
42
-
43
-
44
-
45
-
46
-
47
-
48
-
49
-
50
-
51
-
52
-
53
-
54
-
55
-
56
-
57
-
58
-
59
-
60
-
61
-
62
-
63
-
64
-
65
-
66
-
67
-
68
-
69
-
70
-
71
-
72
-
73
-
74
-
75
-
76
-
77
-
78
-
79
-
80
-
81
-
82
-
83
-
84
-
85
-
86
-
87
-
88
-
89
-
90
-
91
-
92
-
93
-
94
-
95
-
96
-
97
-
98
-
99
-
100
-
101
-
102
-
103
-
104
-
105
-
106
-
107
-
108
-
109
-
110
-
111
-
112
-
113
-
114
-
115
-
116
-
117
-
118
-
119
-
120
-
121
-
122
-
123
-
124
-
125
-
126
-
127
-
128
-
129
-
130
-
131
-
132
-
133
-
134
-
135
-
136
-
137
-
138
-
139
-
140
-
141
-
142
-
143
-
144
-
145
-
146
-
147
-
148
-
149
-
150
-
151
-
152
-
153
-
154
-
155
-
156
-
157
-
158
-
159
-
160
-
161
-
162
-
163
-
164
-
165
-
166
-
167
-
168
 |
 |

W
E
HAVE
DEMONSTRATED
OUR
ENDURANCE
IN
THIS
CHALLENGING
ECONOMIC
CYCLE
BY
STAYING
ON
COURSE
AND
NOT
VEERING
FROM
OUR
RELATIONSHIP
BANKING
STRATEGY
.
D
ESPITE
A
LOW
-
RATE
ENVIRONMENT
AND
UNCERTAINTY
OVER
OUR
NATION
’
S
FISCAL
FUTURE
,
WE
SUCCESSFULLY
NAVIGATED
OUR
WAY
TO
INCREASED
PROFITABILITY
IN
2012,
WITH
STRONG
LOAN
GROWTH
AND
RECORD
DEPOSITS
.
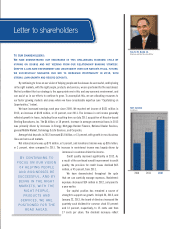
TO OUR SHAREHOLDERS:
B
Y
CONTINUING
TO
FOCUS ON OUR VISION
OF HELPING PEOPLE
AND BUSINESSES BE
SUCCESSFUL, AND BY
BEING IN THE RIGHT
MARKETS, WITH THE
RIGHT PEOPLE,
PRODUCTS AND
SERVICES, WE ARE
POSITIONED FOR THE
ROAD AHEAD.
B
Y
CONTINUING
TO
FOCUS ON OUR VISION
OF HELPING PEOPLE
AND BUSINESSES BE
SUCCESSFUL, AND BY
BEING IN THE RIGHT
MARKETS, WITH THE
RIGHT PEOPLE,
PRODUCTS AND
SERVICES, WE ARE
POSITIONED FOR THE
ROAD AHEAD.
BY CONTINUING TO
FOCUS ON OUR VISION
OF HELPING PEOPLE
AND BUSINESSES BE
SUCCESSFUL, AND BY
BEING IN THE RIGHT
MARKETS, WITH THE
RIGHT PEOPLE,
PRODUCTS AND
SERVICES, WE ARE
POSITIONED FOR THE
ROAD AHEAD.
Letter to shareholders
SM
RALPH W. BABB JR.
Chairman and Chief Executive Officer
NET INCOME
2010 2011 2012
(in millions)
$521
$393
$277
By continuing to focus on our vision of helping people and businesses be successful, and by being
in the right markets, with the right people, products and services, we are positioned for the road ahead.
We feel confident that our strategy is the appropriate one in this and any economic environment, and
can assist us in our efforts to continue to grow. To accomplish this, we are allocating resources to
our faster growing markets and areas where we have considerable expertise (see “Capitalizing on
Opportunities,” below).
We have increased earnings each year since 2009. We reported net income of $521 million in
2012, an increase of $128 million, or 33 percent, over 2011. The increase in net income generally
reflected growth in loans, including those resulting from our July 2011 acquisition of Houston-based
Sterling Bancshares, Inc. The $4 billion, or 18 percent, increase in average commercial loans in 2012
was primarily driven by increases in Energy, Mortgage Banker Finance, National Dealer Services,
general Middle Market, Technology & Life Sciences, and Corporate.
Average total deposits in 2012 increased $5.8 billion, or 13 percent, with growth in most business
lines and across all markets.
Net interest income was up $75 million, or 5 percent, and noninterest income was up $26 million,
or 3 percent, when compared to 2011. The increase in noninterest income was largely driven by
increases in customer-driven fee income.
Credit quality improved significantly in 2012. As
a result of the continued overall improvement in credit
quality, the provision for credit losses declined $65
million, or 45 percent, from 2011.
We have demonstrated throughout the cycle
that we can carefully manage expenses. Noninterest
expenses decreased $14 million in 2012, compared to
a year earlier.
Our capital position has remained a source of
strength to support our growth. On April 24, 2012, and
January 22, 2013, the board of directors increased the
quarterly cash dividend for common stock 50 percent
and 13 percent, respectively, to 15 cents and then
17 cents per share. The dividend increases reflect