ComEd 2009 Annual Report Download - page 30
Download and view the complete annual report
Please find page 30 of the 2009 ComEd annual report below. You can navigate through the pages in the report by either clicking on the pages listed below, or by using the keyword search tool below to find specific information within the annual report.-
 1
1 -
2
-
3
-
4
-
5
-
6
-
7
-
8
-
9
-
10
-
11
-
12
-
13
-
14
-
15
-
16
-
17
-
18
-
19
-
 20
20 -
 21
21 -
 22
22 -
 23
23 -
 24
24 -
 25
25 -
 26
26 -
 27
27 -
 28
28 -
 29
29 -
 30
30 -
 31
31 -
 32
32 -
 33
33 -
 34
34 -
 35
35 -
 36
36 -
 37
37 -
 38
38 -
 39
39 -
 40
40 -
41
-
42
-
43
-
44
 |
 |

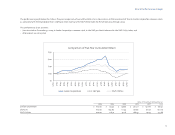
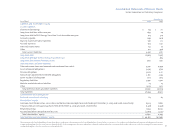
DiscussionofFinancialResults-byBusinessSegment
28
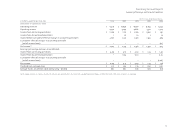
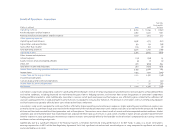
ResultsofOperationsbyBusinessSegment
The comparisons of 2009 and 2008 operating results and other statistical information set forth below include intercompany transactions, which are eliminated in
Exelon’sconsolidatednancialstatements.
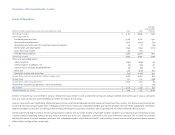
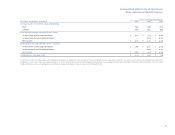
NetIncome(Loss)fromContinuingOperationsbyBusinessSegment
Favorable
(Unfavorable)
2009 2008 Variance
Generation $ 2,122 $ 2,258 $ (136)
ComEd 374 201 173
PECO 353 325 28
Other(a) (143) (67) (76)
Total $ 2,706 $ 2,717 $ (11)
(a) Otherprimarilyincludescorporateoperations,ExelonBusinessServiceCompany,LLC(BSC),investmentsinsyntheticfuel-producingfacilitiesandintersegmenteliminations.
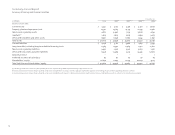
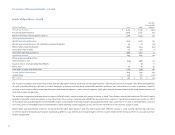
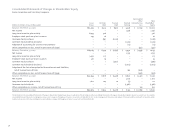
NetIncome(Loss)byBusinessSegment
Favorable
(Unfavorable)
2009 2008 Variance
Generation $ 2,122 $ 2,278 $ (156)
ComEd 374 201 173
PECO 353 325 28
Other(a) (142) (67) (75)
Total $ 2,707 $ 2,737 $ (30)
(a) Otherprimarilyincludescorporateoperations,BSC,investmentsinsyntheticfuel-producingfacilitiesandintersegmenteliminations.