Cogeco 2013 Annual Report Download - page 16
Download and view the complete annual report
Please find page 16 of the 2013 Cogeco annual report below. You can navigate through the pages in the report by either clicking on the pages listed below, or by using the keyword search tool below to find specific information within the annual report.
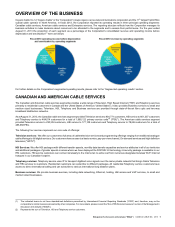
Management's discussion and analysis (“MD&A”) COGECO CABLE INC. 2013 15
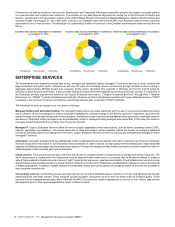
ENTERPRISE SERVICES NETWORKS AND INFRASTRUCTURE
Cogeco Enterprise Services provides its services through its 20 data centres covering in aggregate approximately 360,000 square feet and 56
points-of-presence in North America and Europe. Cogeco Enterprise Services owns one data centre in Barrie, north of Toronto, and has lease
agreements for the other data centres and points of presence.
Cogeco Enterprise Services’ data centres include highly secure and redundant IT infrastructure, including state of the art 24/7/365 monitoring,
regulated climate control, power redundancy, support, and biometrics. In addition, CDS’ data centres are built to Tier 3 standards and the Canadian
Standard on Assurance Engagements ("CSAE") 3416 and Payment Card Industry Data Security Standard ("PCI-DSS") certifications which is a
standard from Uptime Institute in order to meet the expectations of large enterprises and organizations.
During the last fiscal year, CDS announced its plan to build an approximately 100,000 gross square feet data hosting facility in Montréal, which
is expected to open in the Fall of 2014. CDS’ Montréal and Barrie data hosting facilities will be built-out many stages over several years, aligned
with the pace at which we secure multi-year contracts.
CDS provides its connectivity services through an extensive all-optical fibre optic network in Montréal and Toronto and
interconnections with other carriers. PEER 1 provides its services through an extensive fully-managed, all optical fibre optic network in locations
across North America and Europe.
KEY PERFORMANCE INDICATORS AND PERFORMANCE HIGHLIGHTS
Cogeco Cable is dedicated to increasing shareholder value and consequently focuses on optimizing profitability while efficiently managing capital
utilization without jeopardizing future growth. The following key performance indicators are closely monitored to ensure that business strategies
and objectives are closely aligned with shareholder value creation. The key performance indicators are not measurements in accordance with
IFRS and should not be considered an alternative to other measures of performance in accordance with IFRS. The Corporation's method of
calculating key performance indicators may differ from other companies and, accordingly, these key performance indicators may not be comparable
to similar measures presented by other companies. The Corporation measures its performance, with regard to these objectives by monitoring
operating income before depreciation and amortization(1), operating margin(1), free cash flow(1), PSU(2) growth and capital intensity.
Original
projections
November 1, 2012
Revised
projections
July 10, 2013(1) Actual
Achievement
of the revised
projections(2)
Fiscal 2013 Fiscal 2013 Fiscal 2013 Fiscal 2013
(in millions of dollars, except percentages and PSU growth) $ $ $
Financial guidelines
Revenue 1,350 1,695 1,692
Operating income before depreciation and amortization(3) 614 780 781
Operating margin(3) 45.5% 46.0% 46.1%
Integration, restructuring and acquisition costs — 17 22
Depreciation and amortization 290 368 383
Financial expense 64 125 128
Current income taxes expense 95 92 85
Profit for the year 190 205 185
Acquisitions of property, plant and equipment, intangible and other assets(4) 350 401 408
Free cash flow(3) 105 145 150
Capital intensity(3) 26% 24% 24%
Net customer additions guidelines
PSU growth 50,000 15,000 5,546
: Achieved : Under-achieved : Surpassed
(1) The original projections were revised to take into consideration the recent acquisitions of Atlantic Broadband and PEER 1 as well as cost reduction initiatives
in the Canadian cable services.
(2) Achievement of the projections is defined as within 3% above or below the projected amount.
(3) The indicated terms do not have a standardized definition prescribed by IFRS and, therefore, may not be comparable to similar measures presented by other
companies. For more details, please consult the “Non-IFRS financial measures” section.
(4) Fiscal 2013 actual includes $0.9 million of assets acquired under finance leases.
(1) The indicated terms do not have standardized definitions prescribed by IFRS and, therefore, may not be comparable to similar measures presented by other
companies. For more details, please consult the "Non-IFRS financial measures" section.
(2) Represents the sum of Television, High Speed Internet ("HSI") and Telephony service customers.


