Coach 2002 Annual Report Download - page 10
Download and view the complete annual report
Please find page 10 of the 2002 Coach annual report below. You can navigate through the pages in the report by either clicking on the pages listed below, or by using the keyword search tool below to find specific information within the annual report.-
 1
1 -
 2
2 -
 3
3 -
 4
4 -
 5
5 -
 6
6 -
 7
7 -
 8
8 -
 9
9 -
 10
10 -
 11
11 -
 12
12 -
 13
13 -
 14
14 -
 15
15 -
 16
16 -
 17
17 -
 18
18 -
 19
19 -
 20
20 -
 21
21 -
22
-
23
-
24
-
25
-
26
-
27
-
28
-
29
-
30
-
31
-
32
-
33
-
34
-
35
-
36
-
37
-
38
-
39
-
40
-
41
-
42
-
43
-
44
-
45
-
46
-
47
-
48
-
49
-
50
-
51
-
52
-
53
-
54
-
55
-
56
-
57
-
58
-
59
-
60
-
61
-
62
-
63
-
64
-
65
-
66
-
67
-
68
-
69
-
70
-
71
-
72
-
73
-
74
-
75
-
76
-
77
-
78
-
79
-
80
-
81
-
82
-
83
-
84
-
85
-
86
-
87
-
88
-
89
-
90
-
91
-
92
-
93
-
94
-
95
-
96
-
97
-
98
-
99
-
100
-
101
-
102
-
103
-
104
-
105
-
106
-
107
-
108
-
109
-
110
-
111
-
112
-
113
-
114
-
115
-
116
-
117
-
118
-
119
-
120
-
121
-
122
-
123
-
124
-
125
-
126
-
127
-
128
-
129
-
130
-
131
-
132
-
133
-
134
-
135
-
136
-
137
-
138
-
139
-
140
-
141
-
142
-
143
-
144
-
145
-
146
-
147
-
148
-
149
-
150
-
151
-
152
-
153
-
154
-
155
-
156
-
157
-
158
-
159
-
160
-
161
-
162
-
163
-
164
-
165
-
166
-
167
 |
 |

Table of Contents
the revenues generated from the purchase of Coach products by the co-branding partners are not material to the Coach business.
Coach also has a sophisticated consumer and market research capability, which helps us assess consumer attitudes and trends and
gauge likelihood of success in the marketplace prior to product introduction.
Channels of Distribution
Direct Channels
Coach has four different direct channels that provide it with immediate, controlled access to consumers: retail stores, factory stores, e-
commerce and direct mail. The direct-to-consumer business represented approximately 59% of Coach’s total net sales in fiscal year 2003.
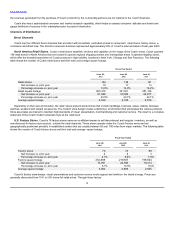
North America Retail Stores. Coach’s retail stores establish, reinforce and capitalize on the image of the Coach brand. Coach operates
156 retail stores in North America that are located in upscale regional shopping centers and metropolitan areas. It operates flagship stores,
which offer the broadest assortment of Coach products in high-visibility locations in New York, Chicago and San Francisco. The following
table shows the number of Coach retail stores and their total and average square footage:
Fiscal Year Ended
June 28, June 29, June 30,
2003 2002 2001
Retail stores 156 138 121
Net increase vs. prior year 18 17 15
Percentage increase vs. prior year 13.0% 14.0% 14.2%
Retail square footage 363,310 301,501 251,136
Net increase vs. prior year 61,809 50,365 42,077
Percentage increase vs. prior year 20.5% 20.1% 20.1%
Average square footage 2,329 2,185 2,076
Depending on their size and location, the retail stores present product lines that include handbags, business cases, wallets, footwear,
watches, weekend and related accessories. The modern store design creates a distinctive environment that showcases the various products.
Store associates are trained to maintain high standards of visual presentation, merchandising and customer service. The result is a complete
statement of the Coach modern American style at the retail level.
U.S. Factory Stores. Coach’s 76 factory stores serve as an efficient means to sell discontinued and irregular inventory, as well as
manufactured-for-factory-store product, outside the retail channels. These stores operate under the Coach Factory name and are
geographically positioned primarily in established centers that are usually between 50 and 100 miles from major markets. The following table
shows the number of Coach factory stores and their total and average square footage:
Fiscal Year Ended
June 28, June 29, June 30,
2003 2002 2001
Factory stores 76 74 68
Net increase vs. prior year 2 6 5
Percentage increase vs. prior year 2.7% 8.8% 7.9%
Factory square footage 232,898 219,507 198,924
Net increase vs. prior year 13,391 20,583 16,414
Percentage increase vs. prior year 6.1% 10.3% 9.0%
Average square footage 3,064 2,966 2,925
Coach’s factory store design, visual presentations and customer service levels support and reinforce the brand’s image. Prices are
generally discounted from 15% to 50% below full retail prices. Through these factory
8