Citrix 2000 Annual Report Download - page 17
Download and view the complete annual report
Please find page 17 of the 2000 Citrix annual report below. You can navigate through the pages in the report by either clicking on the pages listed below, or by using the keyword search tool below to find specific information within the annual report. 15
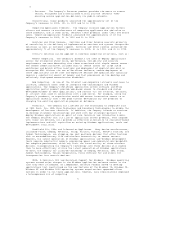
RESULTS OF OPERATIONS
The following table sets forth statement of income data of the Company
expressed as a percentage of net revenues and as a percentage of change from
period−to−period for the periods indicated:
2000 1999
YEAR ENDED DECEMBER 31, COMPARED COMPARED
−−−−−−−−−−−−−−−−−−−−−−− TO TO
2000 1999 1998 1999 1998
−−−−− −−−−− −−−−− −−−−−−−− −−−−−−−−
Net revenues.................................. 100.0% 100.0% 100.0% 16.7% 62.2%
Cost of revenues (excluding amortization
presented separately below)................. 6.2 3.6 6.7 99.3 (12.6)
−−−−− −−−−− −−−−−
Gross margin.................................. 93.8 96.4 93.3 13.6 67.6
Operating expenses:
Research and development.................... 10.8 9.3 9.2 35.5 63.5
Sales, marketing and support................ 38.3 30.1 30.1 48.7 62.0
General and administrative.................. 12.5 9.4 8.1 55.4 87.6
Amortization of intangible assets........... 6.5 4.6 4.1 64.5 81.4
In−process research and development......... −− 0.5 7.4 * *
Write−down of technology.................... 1.9 −− −− * *
−−−−− −−−−− −−−−−
Total operating expenses................. 70.0 53.9 58.9 51.5 48.3
−−−−− −−−−− −−−−−
Income from operations........................ 23.8 42.5 34.4 (34.6) 100.6
Interest and other income..................... 8.5 5.9 4.0 66.8 138.9
Interest expense.............................. (3.6) (3.1) −− 34.6 *
−−−−− −−−−− −−−−−
Income before income taxes.................... 28.7 45.3 38.4 (26.1) 91.4
Income taxes.................................. 8.6 16.3 13.8 (38.4) 91.4
−−−−− −−−−− −−−−−
Net income.................................... 20.1% 29.0% 24.6% (19.2) 91.4
===== ===== =====
−−−−−−−−−−−−−−−
* not meaningful.
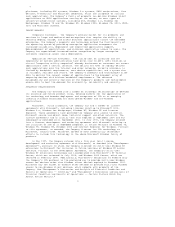
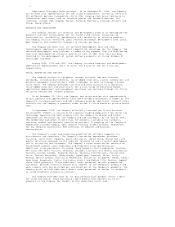
Net Revenues. Net revenues are presented below in five categories:
Application Servers, Management Products, Computing Appliances Products,
Microsoft Royalties and Services and Other Revenue. Application Servers revenue
primarily represents fees related to the licensing of the Company's MetaFrame
products, subscriptions for product support, updates and upgrades and additional
user licenses. Management Products consist of Load Balancing Services, Resource
Management Services and other options. Computing Appliances Products revenue
consists of license fees and royalties from OEMs who are granted a license to
incorporate and/or market the Company's multi−user technologies in their own
product offerings. Microsoft Royalties represent fees recognized in connection
with the Development Agreement. Services and Other Revenue consist primarily of
consulting in the delivery of implementation services and systems integration
solutions, as well as customer support.
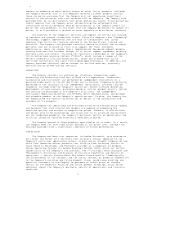
The increase in net revenues in 2000 was primarily attributable to an
increase in Application Servers revenue resulting from an increase in the number
of MetaFrame licenses sold. This increase was partially offset by a decrease in
revenue from the WinFrame product line. WinFrame is Windows application server
software based on Windows NT 3.51. The Company expects that sales of
MetaFrame−based products will continue to make up a large percentage of net
revenues. The increase in net revenues in 2000 was also due to an increase in
the volume of shipments of Management Products, specifically, Load Balancing
Services and Resource Management Services, and to a lesser extent an increase in
Services revenue due mainly to additional consulting revenue resulting from the
Innovex acquisition. The Company anticipates that revenue from the Development
Agreement with Microsoft will account for a decreasing percentage of net
revenues. Net revenues from Computing Appliances Products declined in 2000 due
to decreased volume of licensing to OEMs.
15


