Cisco 2005 Annual Report Download - page 27
Download and view the complete annual report
Please find page 27 of the 2005 Cisco annual report below. You can navigate through the pages in the report by either clicking on the pages listed below, or by using the keyword search tool below to find specific information within the annual report.-
 1
1 -
2
-
3
-
4
-
5
-
6
-
7
-
8
-
9
-
10
-
11
-
12
-
13
-
14
-
15
-
16
-
 17
17 -
 18
18 -
 19
19 -
 20
20 -
 21
21 -
 22
22 -
 23
23 -
 24
24 -
 25
25 -
 26
26 -
 27
27 -
 28
28 -
 29
29 -
 30
30 -
 31
31 -
 32
32 -
 33
33 -
 34
34 -
 35
35 -
 36
36 -
 37
37 -
38
-
39
-
40
-
41
-
42
-
43
-
44
-
45
-
46
-
47
-
48
-
49
-
50
-
51
-
52
-
53
-
54
-
55
-
56
-
57
-
58
-
59
-
60
-
61
-
62
-
63
-
64
-
65
-
66
-
67
-
68
-
69
-
70
-
71
 |
 |

30
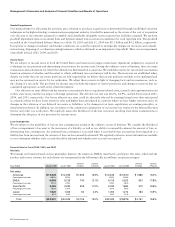
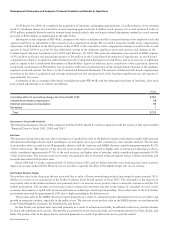
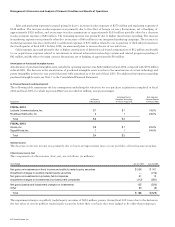
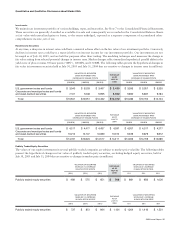
On February 19, 2004, we completed the acquisition of Andiamo, exchanging approximately 23 million shares of our common
stock for Andiamo shares not owned by us and assuming approximately 6 million stock options, for a total estimated value of
$750 million, primarily derived from the revenue-based formula, which after stock price-related adjustments resulted in a total amount
recorded of $722 million as summarized in the table below.
Subsequent to the adoption of FIN 46(R), changes to the value of Andiamo and the continued vesting of the employee stock and
options resulted in an adjustment to the noncash stock compensation charge. We recorded a noncash variable stock compensation
adjustment of $58 million in the third quarter of fiscal 2004 to the cumulative stock compensation charge recorded in the second
quarter of fiscal 2004 to account for the additional vesting of the Andiamo employee stock and options and changes in the
formula-based valuation from January 24, 2004 until February 19, 2004. This noncash adjustment was reported as R&D expense
of $52 million and sales and marketing expense of $6 million in the Consolidated Statements of Operations, as stock-based
compensation related to acquisitions and investments in the Consolidated Statements of Cash Flows, and as an increase to additional
paid-in capital in the Consolidated Statements of Shareholders’ Equity. In addition, upon completion of the acquisition, deferred
stock-based compensation of $90 million was recorded to reflect the unvested portion of the formula-based valuation of the Andiamo
employee stock and options. See Note 3 to the Consolidated Financial Statements. The amount of deferred stock-based compensation
was fixed at the date of acquisition and is being amortized over the vesting period of the Andiamo employee stock and options of
approximately two years.
A summary of the accounting of the initial consolidation under FIN 46(R) and the subsequent purchase of Andiamo, after stock
price-related adjustments, is as follows (in millions):
Discussion of Fiscal 2004 and 2003
The following discussion of fiscal 2004 compared with fiscal 2003 should be read in conjunction with the section of this report entitled
“Financial Data for Fiscal 2005, 2004, and 2003.”
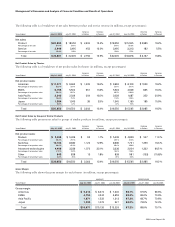
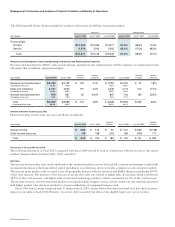
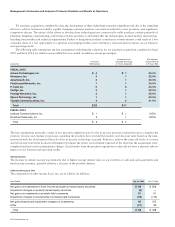
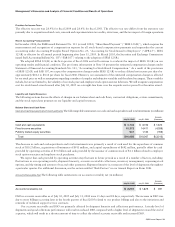
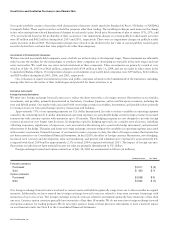
Net Sales
The increase in net product sales was due to the impact of a gradual recovery in the global economic environment coupled with increased
information technology-related capital spending in our enterprise, service provider, commercial, and consumer markets. The increase
in net product sales occurred across all geographic theaters with the Americas and EMEA theaters contributing approximately 82.0%
of the total increase. The majority of the increase in net product sales was related to higher sales of advanced technology products,
which contributed approximately 47.9% of the total increase, and higher sales of switches, which contributed approximately 38.9%
of the total increase. The increase in service revenue was primarily due to increased technical support service contract initiations and
renewals associated with product sales.
Fiscal 2004 had 53 weeks, compared with 52 weeks in fiscal 2003, and we believe that this extra week may have had a positive
impact on our sales in fiscal 2004. However, we are not able to quantify the effect of the slightly longer year on our revenue.
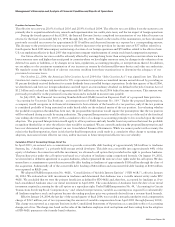
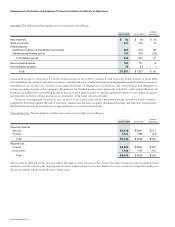
Net Product Sales by Theater
Net product sales in the Americas theater increased due to sales of home networking products increasing by approximately $513
million as a result of our acquisition of the Linksys business in the fourth quarter of fiscal 2003. The remainder of the increase in
net product sales in the Americas theater was primarily due to an increase in net product sales to enterprise customers and the U.S.
federal government. The increase in net product sales to enterprise customers was due to the impact of a gradual recovery in the
economic environment coupled with increased information technology-related capital spending. Net product sales to the U.S. federal
government increased by approximately 20% due to higher spending in the defense sector.
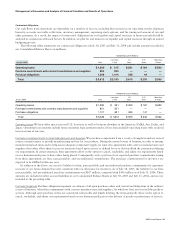
Net product sales in the EMEA theater increased primarily as a result of continued product deployment by service providers and
growth in enterprise markets, especially in the public sector. The increase in net product sales in the EMEA theater occurred primarily
in the United Kingdom, Germany, the Netherlands, and Russia.
In Asia Pacific, net product sales increased primarily as a result of infrastructure builds, broadband acceleration, and investments
by Asian telecommunication carriers. The growth was primarily in the service provider and enterprise markets in China, Korea, and
India. Net product sales in the Japan theater increased primarily as a result of growth in the service provider market.
Management’s Discussion and Analysis of Financial Condition and Results of Operations