Chrysler 2010 Annual Report Download - page 324
Download and view the complete annual report
Please find page 324 of the 2010 Chrysler annual report below. You can navigate through the pages in the report by either clicking on the pages listed below, or by using the keyword search tool below to find specific information within the annual report.-
 1
1 -
2
-
3
-
4
-
5
-
6
-
7
-
8
-
9
-
10
-
11
-
12
-
13
-
14
-
15
-
16
-
17
-
18
-
19
-
20
-
21
-
22
-
23
-
24
-
25
-
26
-
27
-
28
-
29
-
30
-
31
-
32
-
33
-
34
-
35
-
36
-
37
-
38
-
39
-
40
-
41
-
42
-
43
-
44
-
45
-
46
-
47
-
48
-
49
-
50
-
51
-
52
-
53
-
54
-
55
-
56
-
57
-
58
-
59
-
60
-
61
-
62
-
63
-
64
-
65
-
66
-
67
-
68
-
69
-
70
-
71
-
72
-
73
-
74
-
75
-
76
-
77
-
78
-
79
-
80
-
81
-
82
-
83
-
84
-
85
-
86
-
87
-
88
-
89
-
90
-
91
-
92
-
93
-
94
-
95
-
96
-
97
-
98
-
99
-
100
-
101
-
102
-
103
-
104
-
105
-
106
-
107
-
108
-
109
-
110
-
111
-
112
-
113
-
114
-
115
-
116
-
117
-
118
-
119
-
120
-
121
-
122
-
123
-
124
-
125
-
126
-
127
-
128
-
129
-
130
-
131
-
132
-
133
-
134
-
135
-
136
-
137
-
138
-
139
-
140
-
141
-
142
-
143
-
144
-
145
-
146
-
147
-
148
-
149
-
150
-
151
-
152
-
153
-
154
-
155
-
156
-
157
-
158
-
159
-
160
-
161
-
162
-
163
-
164
-
165
-
166
-
167
-
168
-
169
-
170
-
171
-
172
-
173
-
174
-
175
-
176
-
177
-
178
-
179
-
180
-
181
-
182
-
183
-
184
-
185
-
186
-
187
-
188
-
189
-
190
-
191
-
192
-
193
-
194
-
195
-
196
-
197
-
198
-
199
-
200
-
201
-
202
-
203
-
204
-
205
-
206
-
207
-
208
-
209
-
210
-
211
-
212
-
213
-
214
-
215
-
216
-
217
-
218
-
219
-
220
-
221
-
222
-
223
-
224
-
225
-
226
-
227
-
228
-
229
-
230
-
231
-
232
-
233
-
234
-
235
-
236
-
237
-
238
-
239
-
240
-
241
-
242
-
243
-
244
-
245
-
246
-
247
-
248
-
249
-
250
-
251
-
252
-
253
-
254
-
255
-
256
-
257
-
258
-
259
-
260
-
261
-
262
-
263
-
264
-
265
-
266
-
267
-
268
-
269
-
270
-
271
-
272
-
273
-
274
-
275
-
276
-
277
-
278
-
279
-
280
-
281
-
282
-
283
-
284
-
285
-
286
-
287
-
288
-
289
-
290
-
291
-
292
-
293
-
294
-
295
-
296
-
297
-
298
-
299
-
300
-
301
-
302
-
303
-
304
-
305
-
306
-
307
-
308
-
309
-
310
-
311
-
312
-
313
-
 314
314 -
 315
315 -
 316
316 -
 317
317 -
 318
318 -
 319
319 -
 320
320 -
 321
321 -
 322
322 -
 323
323 -
 324
324 -
 325
325 -
 326
326 -
 327
327 -
 328
328 -
 329
329 -
 330
330 -
 331
331 -
 332
332 -
 333
333 -
 334
334 -
335
-
336
-
337
-
338
-
339
-
340
-
341
-
342
-
343
-
344
-
345
-
346
-
347
-
348
-
349
-
350
-
351
-
352
-
353
-
354
-
355
-
356
-
357
-
358
-
359
-
360
-
361
-
362
-
363
-
364
-
365
-
366
-
367
-
368
-
369
-
370
-
371
-
372
-
373
-
374
-
375
-
376
-
377
-
378
-
379
-
380
-
381
-
382
-
383
-
384
-
385
-
386
-
387
-
388
-
389
-
390
-
391
-
392
-
393
-
394
-
395
-
396
-
397
-
398
-
399
-
400
-
401
-
402
 |
 |

323
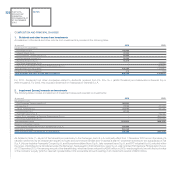
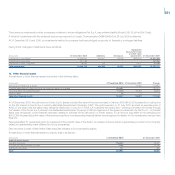
6. Other operating costs
A breakdown of other operating costs is provided in the following table:
(€ thousand) 2010 2009
Costs for services rendered by Group companies 22,810 25,352
Costs for services rendered by third parties 48,298 39,592
Compensation component from stock option and stock grant plans 17,241 8,154
Leases and rentals 3,254 3,685
Purchase of goods 688 734
Depreciation of property, plant and equipment 1,674 1,644
Amortization of intangible assets 40 62
Misc. operating costs 7,586 6,682
Total other operating costs 101,591 85,905
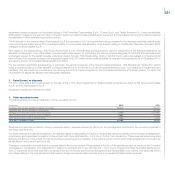
Costs for services rendered by Group companies primarily consisted of assistance and consultancy of an administrative and financial nature, public relations,
payroll services, security services and internal audit services (see Note 30).
Costs for services rendered by third parties principally included legal, administrative and financial services as well as IT and technical services (T.A.V.).
The increase over the prior year also reflects costs related to the Demerger of approximately €8 million.
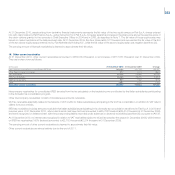
For 2010, compensation for directors and statutory auditors of Fiat S.p.A. amounted to €6,554 thousand and €230 thousand, respectively. The amount
of directors’ fees includes fees resolved by shareholders as well as compensation established by the Board of Directors for directors vested with specific
responsibilities.
The compensation component from stock option and stock grant plans is connected with the options granted to the Chief Executive Officer and is
represented by the notional cost, with the offsetting credit recognized directly in the relevant equity reserve (see Note 19).
Miscellaneous operating costs consist of subscriptions to trade associations, indirect taxes and duties (local property taxes, non-deductible VAT, etc.),
prior year expenses and other minor costs.
7. Financial income/(expense)
Following is a breakdown of financial income/(expense):
(€ thousand) 2010 2009
Financial income 31,210 14,190
Financial expense (234,830) (144,873)
Net gains/(losses) from derivative financial instruments 110,585 116,992
Total financial income/(expense) (93,035) (13,691)