Chrysler 2009 Annual Report Download - page 217
Download and view the complete annual report
Please find page 217 of the 2009 Chrysler annual report below. You can navigate through the pages in the report by either clicking on the pages listed below, or by using the keyword search tool below to find specific information within the annual report.-
 1
1 -
2
-
3
-
4
-
5
-
6
-
7
-
8
-
9
-
10
-
11
-
12
-
13
-
14
-
15
-
16
-
17
-
18
-
19
-
20
-
21
-
22
-
23
-
24
-
25
-
26
-
27
-
28
-
29
-
30
-
31
-
32
-
33
-
34
-
35
-
36
-
37
-
38
-
39
-
40
-
41
-
42
-
43
-
44
-
45
-
46
-
47
-
48
-
49
-
50
-
51
-
52
-
53
-
54
-
55
-
56
-
57
-
58
-
59
-
60
-
61
-
62
-
63
-
64
-
65
-
66
-
67
-
68
-
69
-
70
-
71
-
72
-
73
-
74
-
75
-
76
-
77
-
78
-
79
-
80
-
81
-
82
-
83
-
84
-
85
-
86
-
87
-
88
-
89
-
90
-
91
-
92
-
93
-
94
-
95
-
96
-
97
-
98
-
99
-
100
-
101
-
102
-
103
-
104
-
105
-
106
-
107
-
108
-
109
-
110
-
111
-
112
-
113
-
114
-
115
-
116
-
117
-
118
-
119
-
120
-
121
-
122
-
123
-
124
-
125
-
126
-
127
-
128
-
129
-
130
-
131
-
132
-
133
-
134
-
135
-
136
-
137
-
138
-
139
-
140
-
141
-
142
-
143
-
144
-
145
-
146
-
147
-
148
-
149
-
150
-
151
-
152
-
153
-
154
-
155
-
156
-
157
-
158
-
159
-
160
-
161
-
162
-
163
-
164
-
165
-
166
-
167
-
168
-
169
-
170
-
171
-
172
-
173
-
174
-
175
-
176
-
177
-
178
-
179
-
180
-
181
-
182
-
183
-
184
-
185
-
186
-
187
-
188
-
189
-
190
-
191
-
192
-
193
-
194
-
195
-
196
-
197
-
198
-
199
-
200
-
201
-
202
-
203
-
204
-
205
-
206
-
 207
207 -
 208
208 -
 209
209 -
 210
210 -
 211
211 -
 212
212 -
 213
213 -
 214
214 -
 215
215 -
 216
216 -
 217
217 -
 218
218 -
 219
219 -
 220
220 -
 221
221 -
 222
222 -
 223
223 -
 224
224 -
 225
225 -
 226
226 -
 227
227 -
228
-
229
-
230
-
231
-
232
-
233
-
234
-
235
-
236
-
237
-
238
-
239
-
240
-
241
-
242
-
243
-
244
-
245
-
246
-
247
-
248
-
249
-
250
-
251
-
252
-
253
-
254
-
255
-
256
-
257
-
258
-
259
-
260
-
261
-
262
-
263
-
264
-
265
-
266
-
267
-
268
-
269
-
270
-
271
-
272
-
273
-
274
-
275
-
276
-
277
-
278
-
279
-
280
-
281
-
282
-
283
-
284
-
285
-
286
-
287
-
288
-
289
-
290
-
291
-
292
-
293
-
294
-
295
-
296
-
297
-
298
-
299
-
300
-
301
-
302
-
303
-
304
-
305
-
306
-
307
-
308
-
309
-
310
-
311
-
312
-
313
-
314
-
315
-
316
-
317
-
318
-
319
-
320
-
321
-
322
-
323
-
324
-
325
-
326
-
327
-
328
-
329
-
330
-
331
-
332
-
333
-
334
-
335
-
336
-
337
-
338
-
339
-
340
-
341
-
342
-
343
-
344
-
345
-
346
-
347
-
348
-
349
-
350
-
351
-
352
-
353
-
354
-
355
-
356
-
357
-
358
-
359
-
360
-
361
-
362
-
363
-
364
-
365
-
366
-
367
-
368
-
369
-
370
-
371
-
372
-
373
-
374
 |
 |

216 FIAT GROUP
CONSOLIDATED
FINANCIAL
STATEMENTS
AT 31 DECEMBER
2009
NOTES
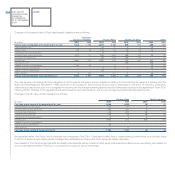
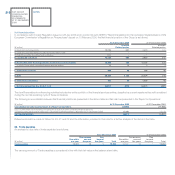
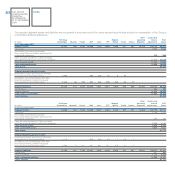
Net financial position
In compliance with Consob Regulation issued on 28 July 2006 and in conformity with CESR’s “Recommendations for the consistent implementation of the
European Commission’s Regulation on Prospectuses” issued on 10 February 2005, the Net financial position of the Group is as follows:
At 31 December 2009 At 31 December 2008
of which of which
(€ million)
Related parties Related parties
A. Cash and cash equivalents 12,226 651 3,683 101
B. Cash and cash equivalents included as Assets held for sale - - - -
C. Current securities (securities held for trading) 217 - 177 -
D. Liquidity (D) = (A+B+C) 12,443 651 3,860 101
E. Receivables from financing activities (Current financial receivables) 12,695 120 13,136 134
of which: From jointly controlled financial services entities 14 14 3 3
F. Other financial assets 636 52 764 46
G. Debt 28,527 1,144 21,379 773
H. Other financial liabilities 464 49 1,202 95
I. Net financial position (I) = (D+E+F-G-H) (3,217) (370) (4,821) (587)
The item Receivables from financing activities includes the entire portfolio of the financial services entities, classified as current assets as they will be realised
during the normal operating cycle of these companies.
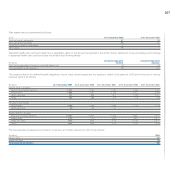
The following is reconciliation between Net financial position as presented in the above table and Net debt as presented in the Report on Operations:
(€ million) At 31 December 2009 At 31 December 2008
Consolidated net debt as presented in the Report on Operations (15,898) (17,954)
Less: Current financial receivables, excluding those due from jointly controlled financial services
companies amounting to €14 million at 31 December 2009 (amounting to €3 million at 31 December 2008) 12,681 13,133
Net financial position (3,217) (4,821)
Reference should be made to Notes 19, 20, 21 and 22 and the information provided in this note for a further analysis of the items in the table.
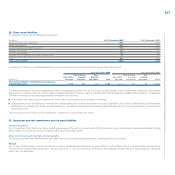
Trade payables28.
An analysis by due date of trade payables is as follows:
At 31 December 2009 At 31 December 2008
Due between Due Due between Due
Due within one and beyond Due within one and beyond
(€ million) one year five years five years Total one year five years five years Total
Trade payables 12,281 13 1 12,295 13,224 33 1 13,258
The carrying amount of Trade payables is considered in line with their fair value at the balance sheet date.