Chrysler 2008 Annual Report Download - page 134
Download and view the complete annual report
Please find page 134 of the 2008 Chrysler annual report below. You can navigate through the pages in the report by either clicking on the pages listed below, or by using the keyword search tool below to find specific information within the annual report.-
 1
1 -
2
-
3
-
4
-
5
-
6
-
7
-
8
-
9
-
10
-
11
-
12
-
13
-
14
-
15
-
16
-
17
-
18
-
19
-
20
-
21
-
22
-
23
-
24
-
25
-
26
-
27
-
28
-
29
-
30
-
31
-
32
-
33
-
34
-
35
-
36
-
37
-
38
-
39
-
40
-
41
-
42
-
43
-
44
-
45
-
46
-
47
-
48
-
49
-
50
-
51
-
52
-
53
-
54
-
55
-
56
-
57
-
58
-
59
-
60
-
61
-
62
-
63
-
64
-
65
-
66
-
67
-
68
-
69
-
70
-
71
-
72
-
73
-
74
-
75
-
76
-
77
-
78
-
79
-
80
-
81
-
82
-
83
-
84
-
85
-
86
-
87
-
88
-
89
-
90
-
91
-
92
-
93
-
94
-
95
-
96
-
97
-
98
-
99
-
100
-
101
-
102
-
103
-
104
-
105
-
106
-
107
-
108
-
109
-
110
-
111
-
112
-
113
-
114
-
115
-
116
-
117
-
118
-
119
-
120
-
121
-
122
-
123
-
 124
124 -
 125
125 -
 126
126 -
 127
127 -
 128
128 -
 129
129 -
 130
130 -
 131
131 -
 132
132 -
 133
133 -
 134
134 -
 135
135 -
 136
136 -
 137
137 -
 138
138 -
 139
139 -
 140
140 -
 141
141 -
 142
142 -
 143
143 -
 144
144 -
145
-
146
-
147
-
148
-
149
-
150
-
151
-
152
-
153
-
154
-
155
-
156
-
157
-
158
-
159
-
160
-
161
-
162
-
163
-
164
-
165
-
166
-
167
-
168
-
169
-
170
-
171
-
172
-
173
-
174
-
175
-
176
-
177
-
178
-
179
-
180
-
181
-
182
-
183
-
184
-
185
-
186
-
187
-
188
-
189
-
190
-
191
-
192
-
193
-
194
-
195
-
196
-
197
-
198
-
199
-
200
-
201
-
202
-
203
-
204
-
205
-
206
-
207
-
208
-
209
-
210
-
211
-
212
-
213
-
214
-
215
-
216
-
217
-
218
-
219
-
220
-
221
-
222
-
223
-
224
-
225
-
226
-
227
-
228
-
229
-
230
-
231
-
232
-
233
-
234
-
235
-
236
-
237
-
238
-
239
-
240
-
241
-
242
-
243
-
244
-
245
-
246
-
247
-
248
-
249
-
250
-
251
-
252
-
253
-
254
-
255
-
256
-
257
-
258
-
259
-
260
-
261
-
262
-
263
-
264
-
265
-
266
-
267
-
268
-
269
-
270
-
271
-
272
-
273
-
274
-
275
-
276
-
277
-
278
-
279
-
280
-
281
-
282
-
283
-
284
-
285
-
286
-
287
-
288
-
289
-
290
-
291
-
292
-
293
-
294
-
295
-
296
-
297
-
298
-
299
-
300
-
301
-
302
-
303
-
304
-
305
-
306
-
307
-
308
-
309
-
310
-
311
-
312
-
313
-
314
-
315
-
316
-
317
-
318
-
319
-
320
-
321
-
322
-
323
-
324
-
325
-
326
-
327
-
328
-
329
-
330
-
331
-
332
-
333
-
334
-
335
-
336
-
337
-
338
-
339
-
340
-
341
-
342
-
343
-
344
-
345
-
346
-
347
-
348
-
349
-
350
-
351
-
352
-
353
-
354
-
355
-
356
 |
 |

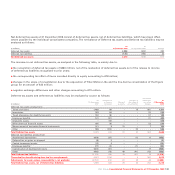
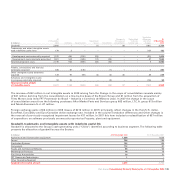
Net deferred tax assets at 31 December 2008 consist of deferred tax assets, net of deferred tax liabilities, which have been offset
where possible by the individual consolidated companies. The net balance of Deferred tax assets and Deferred tax liabilities may be
analysed as follows:
At At
(€ millions) 31 December 2008 31 December 2007 Change
Deferred tax assets 2,386 1,892 494
Deferred tax liabilities (170) (193) 23
Net deferred tax assets 2,216 1,699 517
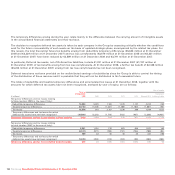
The increase in net deferred tax assets, as analysed in the following table, is mainly due to:
the recognition of deferred tax assets of €480 million, net of the realisation of deferred tax assets net of the release to income
of deferred tax liabilities recognised in prior years;
the corresponding tax effect of items recorded directly in equity amounting to €78 million;
changes in the scope of consolidation due to the acquisition of Tritec Motors Ltda and the line-by-line consolidation of the Ergom
group for an amount of €32 million;
negative exchange differences and other changes amounting to €73 million.
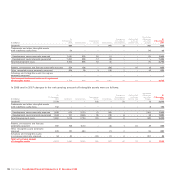
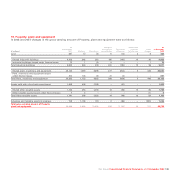
Deferred tax assets and deferred tax liabilities may be analysed by source as follows:
Translation
At Recognised Changes in differences At
31 December in Income Charged the scope of and other 31 December
(€ millions) 2007 statement to equity consolidation changes 2008
Deferred tax assets arising from:
- Taxed provisions 1,489 88 – 15 (81) 1,511
- Inventories 183 64 – – (2) 245
- Taxed allowances for doubtful accounts 162 (6) – – (7) 149
- Employee benefits 501 (91) – – (1) 409
- Intangible assets –418 – – –418
- Write-downs of financial assets 165 56 – – (3) 218
- Measurement of derivative financial instruments 141 9 31 – 7 188
-Other 588 (102) – 22 – 508
Total Deferred tax assets 3,229 436 31 37 (87) 3,646
Deferred tax liabilities arising from:
- Accelerated depreciation (658) (27) – (5) 11 (679)
- Deferred tax on gains on disposal (8) 2 – – – (6)
- Capital investment grants (13) 3 – – – (10)
- Employee benefits (27) (2) – (1) – (30)
- Capitalisation of development costs (822) (21) – – 17 (826)
- Other (642) (13) 49 (41) (12) (659)
Total Deferred tax liabilities (2,170) (58) 49 (47) 16 (2,210)
Theoretical tax benefit arising from tax loss carryforwards 4,431 (710) – 3 (45) 3,679
Adjustments for assets whose recoverability is not probable (3,791) 812 (2) 39 43 (2,899)
Total Deferred tax assets, net of Deferred tax liabilities 1,699 480 78 32 (73) 2,216
Fiat Group Consolidated Financial Statements at 31 December 2008 133