Chili's 2010 Annual Report Download - page 13
Download and view the complete annual report
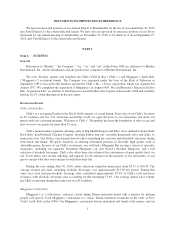
Please find page 13 of the 2010 Chili's annual report below. You can navigate through the pages in the report by either clicking on the pages listed below, or by using the keyword search tool below to find specific information within the annual report.
Company Development
Our near-term focus continues to be less on domestic development of new company-operated restaurants
allowing us to focus on our other strategic initiatives and areas of focus. We will continue to evaluate the
development of new company-operated restaurants.
The following table illustrates the system-wide restaurants opened in fiscal 2010 and the planned openings
in fiscal 2011:
Fiscal 2010
Openings(1)
Fiscal 2011
Projected Openings
Chili’s:
Company-operated ..................................... — —
Franchise(2) .......................................... 13 10-13
Maggiano’s ............................................. 1 —
International:
Company-operated(3) .................................. — —
Franchise(3) .......................................... 23 43-48
Total .............................................. 37 53-61
(1) The numbers in this column are the total of new restaurant openings and openings of relocated
restaurants during fiscal 2010.
(2) The numbers on this line for fiscal 2011 are projected domestic franchise openings.
(3) The numbers on this line are for Chili’s and Maggiano’s.
We periodically reevaluate company-owned restaurant sites to ensure that site attributes have not
deteriorated below our minimum standards. In the event site deterioration occurs, each brand makes a concerted
effort to improve the restaurant’s performance by providing physical, operating and marketing enhancements
unique to each restaurant’s situation. If efforts to restore the restaurant’s performance to acceptable minimum
standards are unsuccessful, the brand considers relocation to a proximate, more desirable site, or evaluates
closing the restaurant if the brand’s measurement criteria, such as return on investment and area demographic
trends, do not support relocation. Since inception, relating to our current restaurant brands, we have closed 138
restaurants, including 11 in fiscal 2010. We perform a comprehensive analysis that examines restaurants not
performing at a required rate of return. A portion of these closed restaurants were performing below our
standards or were near or at the expiration of their lease term. Our strategic plan is targeted to support our long-
term growth objectives, with a focus on continued development of those restaurant brands that have the greatest
return potential for the Company and our shareholders.
Our capital investment in new restaurants may differ in the future due to building design specifications, site
location, and site characteristics. We did not open any company-owned Chili’s restaurants and only opened one
Maggiano’s restaurant in fiscal 2010. The following table illustrates the approximate average capital investment
for company-owned restaurants opened in the noted periods:
Chili’s(3) Maggiano’s(4)
Land(1) ................................................... $1,215,000 $1,529,000
Building ................................................... 1,940,000 4,693,000
Furniture & Equipment ....................................... 525,000 1,299,000
Other(2) ................................................... 55,000 34,000
Total .................................................... $3,735,000 $7,555,000
(1) This amount represents the average cost for land acquisition, capital lease values net of landlord
contributions (or an equivalent amount for operating lease costs also net of landlord contributions)
based on estimated lease payments and other costs that will be incurred through the term of the
lease.
5


