Chesapeake Energy 1995 Annual Report Download - page 6
Download and view the complete annual report
Please find page 6 of the 1995 Chesapeake Energy annual report below. You can navigate through the pages in the report by either clicking on the pages listed below, or by using the keyword search tool below to find specific information within the annual report.-
 1
1 -
 2
2 -
 3
3 -
 4
4 -
 5
5 -
 6
6 -
 7
7 -
 8
8 -
 9
9 -
 10
10 -
 11
11 -
 12
12 -
 13
13 -
 14
14 -
 15
15 -
 16
16 -
 17
17 -
18
-
19
-
20
-
21
-
22
-
23
-
24
-
25
-
26
-
27
-
28
-
29
-
30
-
31
-
32
-
33
-
34
-
35
-
36
-
37
-
38
-
39
-
40
-
41
-
42
-
43
-
44
-
45
-
46
-
47
-
48
-
49
-
50
-
51
-
52
-
53
-
54
-
55
-
56
-
57
 |
 |

LETTER TO SHAREHOLDERS
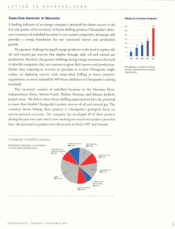
First, this strategy enables Chesapeake to capture more upside potential
from drilling new wells. In the company's project areas, new wells can develop
reserves with a value of up to Live times the cost of drilling such wells. We
accomplish this result by integrating enhanced seismic information with our
drilling and completion expertise to develop new reservoirs. Our expertise with
new exploration technologies greatly reduces geological risk while earning
attractive returns even with today's low commodity prices.
Secondly, because most major oil and natural gas producers have
significantly reduced domestic exploration efforts and many independent
producers have focused on acquiring producing properties, there is less
competition for good exploration ideas. With less competition, Chesapeake has
a greater opportunity to leverage its exploration expertise into new areas that
have the potential to significantly increase the company's value.
The third reason for Chesapeake's growth through the drillbit strategy is
the efficiency created from owning new wells. Just as in operating a new car or
factory, operating a newly drilled well is less expensive than operating an older
well. Consequently, the company's production and administrative costs per
unit of production are the lowest among its peers. Chesapeake therefore has
more cash flow available per unit of production to reinvest in its drilling
program, providing funding to continue growing the company's oil and natural
gas reserves.
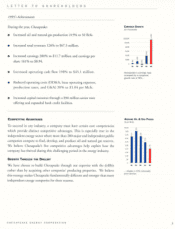
The success of this growth through the drilibit strategy is most evident in
Chesapeake's oil and natural gas production growth. In the fourth quarter of
fiscal 1993, Chesapeake's first full quarter as a public company, the company
produced 1.1 Bcfe. By the fourth quarter of fiscal 1995, just two years later,
Chesapeake's production increased to 11.9 Bcfe, an increase of almost 1,000%.
The company's creativity in identifying attractive geological opportunities,
its technological expertise, and its financial resources have enabled Chesapeake,
at the end of fiscal 1995 to be the third most active driller onshore in the U.S.,
ranking behind two much larger companies, Amoco and Union Pacific
Resources.
Also at the end of fiscal 1995, Chesapeake ranked first in average depth
drilled per well (almost 15,000 feet). By drilling deeper into less extensively
explored reservoirs, Chesapeake has a greater possibility of discovering large
amounts of previously undiscovered or undeveloped oil and natural gas reserves.
These prolific deposits of hydrocarbons are now within the company's reach due
to technological advances in seismic and drilling and completion techniques.
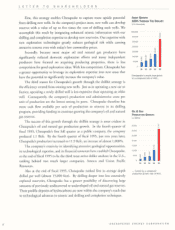
ASSET GROWTH
100% THROUGH THE DRILLBIT
In thousands)
$350,000
300,000
250.000
200,000
150,000
100.000
50,000
91 92 93 94 95
Chesapeake's assets have grown
at a compound rate of 44%...
OIL & GAS
PRODUCTION GROWTH
110 MMcfe)
35,000
30.000
25.000
20,000
15,000
10.000
5,000 4
0-uI
91 92 93 94 95
fueled by a compound
production growth rate of 81%.
4CHESAPEAKE ENERGY CORPORATION