CenturyLink 2013 Annual Report Download - page 8
Download and view the complete annual report
Please find page 8 of the 2013 CenturyLink annual report below. You can navigate through the pages in the report by either clicking on the pages listed below, or by using the keyword search tool below to find specific information within the annual report.-
 1
1 -
 2
2 -
 3
3 -
 4
4 -
 5
5 -
 6
6 -
 7
7 -
 8
8 -
 9
9 -
 10
10 -
 11
11 -
 12
12
 |
 |

Dollars in millions, except per share amounts 5-year
Shares, lines and subscribers in thousands 2013 2012 2011 2010 2009 2008 CAGR(1)
oooooooooooooooooooooooooooooooooooooooooooooooooooooooooooooooooooooooooooooooooooooooooo ooooooooooooooooooooo oooooooooooooooooooooooooooooooooooooooooooooooooooooooooooooooooooooooooooooooooooooooooooooooooooooooooooooooooooooooooooooooooo
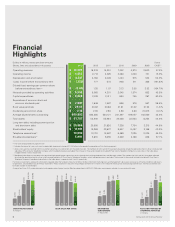
Operating revenues $ 18,095 18,376 15,351 7,042 4,974 2,600 47.4 %
Operating income $ 1,453 2,713 2,025 2,060 1,233 721 15.0 %
Depreciation and amortization $ 4,541 4,780 4,026 1,434 975 524 54.0 %
(Loss) Income before extraordinary item $ (239) 777 573 948 511 366 (191.8) %
Diluted (loss) earnings per common share
before extraordinary item(2) $ (0.40) 1.25 1.07 3.13 2.55 3.52 (164.7 )%
Net cash provided by operating activities $ 5,559 6,065 4,201 2,045 1,574 853 45.5 %
Capital expenditures $ 3,048 2,919 2,411 864 755 287 60.4 %
Repurchase of common stock and
common dividends paid $ 2,887 1,848 1,587 896 576 567 38.5 %
Book value per share $ 29.45 30.82 33.66 31.61 31.62 31.54 (1.4) %
Dividends per common share $ 2.16 2.90 2.90 2.90 2.80 2.1675 (0.1) %
Average diluted shares outstanding 600,892 622,285 534,121 301,297 199,057 102,560 42.4 %
Total assets $ 51,787 53,940 55,964 22,038 22,563 8,254 44.4 %
Long-term debt, including current portion
and short-term debt $ 20,966 20,605 21,836 7,328 7,754 3,315 44.6 %
Stockholders’ equity $ 17,191 19,289 20,827 9,647 9,467 3,168 40.3 %
Telephone access lines(3) 13,002 13,751 14,587 6,489 7,025 2,025 45.0 %
Broadband subscribers(4) 5,991 5,851 5,655 2,349 2,186 626 57.1 %
oooooooooooooooooooooooooooooooooooooooooooooooooooooooooooooooooooooooooooooooooooooooooo ooooooooooooooooooooo oooooooooooooooooooooooooooooooooooooooooooooooooooooooooooooooooooooooooooooooooooooooooooooooooooooooooooooooooooooooooooooooooo
oooooooooooooooooooooooooooooooooooooooooooooooooooooooooooooooooooooooooooooooooooooooooo ooooooooooooooooooooo oooooooooooooooooooooooooooooooooooooooooooooooooooooooooooooooooooooooooooooooooooooooooooooooooooooooooooooooooooooooooooooooooo
(1) Five-year compounded annual growth rate
(2) Includes the impact of a non-cash, non-tax deductible impairment charge of $1.092 billion to the goodwill assigned to our Data Hosting segment
(3) Access lines are lines reaching from the customers’ premises to a connection with the public network. The numbers for 2012 and 2011 have been adjusted to include the operational metrics of our wholly owned
subsidiary, El Paso County Telephone Company, which had been previously excluded. The increase (in thousands) related to including El Paso County Telephone Company’s access lines in the table above,
is approximately 3 and 3, respectively.
(4) Broadband subscribers are customers that purchase high-speed Internet connection service through their existing telephone lines and fiber-optic cables. The numbers for 2012 and 2011 have been adjusted
to include the operational metrics of our wholly owned subsidiary, El Paso County Telephone Company, which had been previously excluded. The increase (in thousands) related to including El Paso County
Telephone Company’s broadband subscribers in the table above, is approximately 3 and 3, respectively.
Full financial statements, along with certifications required under the Sarbanes-Oxley Act of 2002, the New York Stock Exchange rules and management’s discussion and analysis of financial condition and results
of operations, are provided in our 2014 Proxy Statement (“Proxy Statement”) and 2013 Annual Report on Form 10-K (“Form 10-K”) filed with the Securities and Exchange Commission. The Proxy Statement will
be made available to shareholders.
A copy of our Form 10-K can be obtained at no charge by contacting our Investor Relations department at 800.833.1188 or by accessing our website at www.centurylink.com.
Financial
Highlights
OPERATING REVENUES
in millions
09 10 11 12 13
$4,974
$7,042
$15,351
$18,376
$18,095
BOOK VALUE PER SHARE
09 10 11 12 13
$31.62
$31.61
$33.66
$30.82
$29.45
BROADBAND
SUBSCRIBERS
in thousands
09 10 11 12 13
2,186
2,394
5,655
5,851
5,991
NET CASH PROVIDED BY
OPERATING ACTIVITIES
in millions
09 10 11 12 13
$1,574
$2,045
$4,201
$6,065
$5,559
6 CenturyLink 2013 Annual Review