CenturyLink 2012 Annual Report Download - page 8
Download and view the complete annual report
Please find page 8 of the 2012 CenturyLink annual report below. You can navigate through the pages in the report by either clicking on the pages listed below, or by using the keyword search tool below to find specific information within the annual report.-
 1
1 -
 2
2 -
 3
3 -
 4
4 -
 5
5 -
 6
6 -
 7
7 -
 8
8 -
 9
9 -
 10
10 -
 11
11 -
 12
12
 |
 |

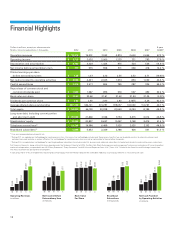
Dollars in millions, except per shareamounts.5-year
Shares, lines and subscribersin thousands. 2012 2011 2010 2009 2008 2007 CAGR(1)
Operatingrevenues$18,37615,3517,042 4,974 2,600 2,656 47.2 %
Operatingincome $2,713 2,025 2,060 1,233 72179327.9 %
Depreciation andamortization $4,780 4,026 1,434 97552453654.9 %
Netincome before extraordinary item $777 57394851136641813.2 %
Diluted earningsper share
beforeextraordinary item $1.25 1.07 3.13 2.55 3.52 3.71 (19.6)%
Netcash provided by operatingactivities $6,065 4,201 2,045 1,574 853 1,030 42.6 %
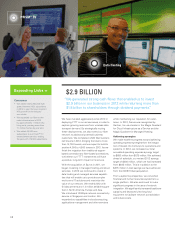
Capital expenditures $ 2,919 2,411 86475528732655.0 %
Repurchase of common stock and
commondividendspaid $1,848 1,587 896 57656749030.4 %
Book valueper share$30.82 33.6631.61 31.62 31.54 31.25 (0.3)%
Dividendsper common share $ 2.90 2.90 2.90 2.80 2.16750.26 62.0 %
Average diluted sharesoutstanding622,285 534,121 301,297 199,057 102,560 112,787 40.7 %
Total assets$54,020 56,13922,038 22,563 8,254 8,185 45.9 %
Long-termdebt,including currentportion
andshort-term debt $20,605 21,8367,328 7,754 3,315 3,014 46.9 %
Stockholders’equity $19,289 20,8279,647 9,467 3,168 3,416 41.4 %
Telephone accesslines(2) 13,74814,5846,489 7,025 2,025 2,152 44.9 %
Broadband subscribers(3)5,848 5,652 2,349 2,186 62654161.0 %
(1) Five-yearcompounded annualgrowth rate
(2)During2011, we updatedour methodologyfor counting accesslines. Our access line methodology includes only thoseaccess lines that we use to provide servicesto external customers and
excludes lines usedsolely by us and our affiliates. Ourmethodologyfor counting accesslines may not be comparable to those of other companies.
(3)During2012,we updatedour methodologyfor counting broadbandsubscribersto includeresidential, business and wholesale subscribersinstead of only residentialand smallbusiness subscribers.
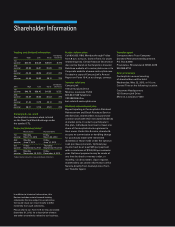
Full financialstatements, along with certifications required under the Sarbanes-Oxley Actof 2002, the NewYork Stock Exchange rules andmanagement’sdiscussion and analysis of financial condition
andresults of operations, are provided in our 2013 ProxyStatement (“Proxy Statement”) and2012 AnnualReport on Form10 -K (“Form10-K”) filed with the Securities andExchange Commission.
TheProxyStatement will be mailed to shareholders.
A copy of our Form 10-K can be obtained at no charge by contactingour InvestorRelations department at 800.833.1188or by accessingour website at www.centurylink.com.
626
2,186
2,394
5,652
5,848
Broadband
Subscribers
in thousands
08 09 10 11 12
$853
$1,574
$2,045
$4,201
$6,065
NetCash Provided
by OperatingActivities
in millions
08 09 10 11 12
$366
$511
$948
$573
NetIncome Before
Extraordinary Item
in millions
08 09 10 11 12
$777
$2,600
$4,974
$7,042
$15,351
$18,376
OperatingRevenues
in millions
08 09 10 11 12
6
Financial Highlights
$31.25
08
$31.62
09
$31.61
10
$33.66
11
$30.82
12
Book Value
PerShare