CenterPoint Energy 2013 Annual Report Download - page 16
Download and view the complete annual report
Please find page 16 of the 2013 CenterPoint Energy annual report below. You can navigate through the pages in the report by either clicking on the pages listed below, or by using the keyword search tool below to find specific information within the annual report.-
 1
1 -
2
-
3
-
4
-
5
-
 6
6 -
 7
7 -
 8
8 -
 9
9 -
 10
10 -
 11
11 -
 12
12 -
 13
13 -
 14
14 -
 15
15 -
 16
16 -
 17
17 -
 18
18 -
 19
19 -
 20
20 -
 21
21 -
 22
22 -
 23
23 -
 24
24 -
 25
25 -
 26
26 -
27
-
28
-
29
-
30
-
31
-
32
-
33
-
34
-
35
-
36
-
37
-
38
-
39
-
40
-
41
-
42
-
43
-
44
-
45
-
46
-
47
-
48
-
49
-
50
-
51
-
52
-
53
-
54
-
55
-
56
-
57
-
58
-
59
-
60
-
61
-
62
-
63
-
64
-
65
-
66
-
67
-
68
-
69
-
70
-
71
-
72
-
73
-
74
-
75
-
76
-
77
-
78
-
79
-
80
-
81
-
82
-
83
-
84
-
85
-
86
-
87
-
88
-
89
-
90
-
91
-
92
-
93
-
94
-
95
-
96
-
97
-
98
-
99
-
100
-
101
-
102
-
103
-
104
-
105
-
106
-
107
-
108
-
109
-
110
-
111
-
112
-
113
-
114
-
115
-
116
-
117
-
118
-
119
-
120
-
121
-
122
-
123
-
124
-
125
-
126
-
127
-
128
-
129
-
130
-
131
-
132
-
133
-
134
-
135
-
136
-
137
-
138
-
139
-
140
-
141
-
142
-
143
-
144
-
145
-
146
-
147
-
148
-
149
-
150
-
151
-
152
-
153
-
154
-
155
-
156
 |
 |

centerpointenergy.com/annualreports/
ON POINT CenterPoint Energy Annual Report
Our natural gas distribution business had a record year financially,
thanks to rate relief, growth, cost management eorts and a
returnto more normal weather. Operating income for the year
wasmillion, far exceeding the previous high of million,
set in.
Capturing operational eciencies continued to be a focal point of our eorts, and we
saw significant progress in this area. We completed deployment of our advanced meter
reading technology in Oklahoma and in parts of our territory in Louisiana, Minnesota
and Texas; we are on schedule to complete deployment to our entire system by the end
of . Drive-by meter reading enables us to read , meters per day per vehicle,
as opposed to meters per person. We’re also able to read meters more accurately,
without accessing our customers’ premises.
Economic growth across our footprint helped us add more than , customers,
ledby the greater Houston area and Minneapolis. An initiative in our Oklahoma service
territory has, for the first time, given us access to provide natural gas services to
developers of multi-family residences, which we expect to help fuel growth in that
market as well.
Increased focus on the safety of the nation’s pipeline infrastructure will result in
ongoing capital investment for system modernization. In , we continued to replace
remaining cast iron and bare steel pipe across our entire gas distribution system. In
Minneapolis, we completed the first phase of a -mile pipeline rehabilitation project.
This project, which includes pipe replacement and refurbishment, is part of our
Minnesota distribution system. Capital expenditures for are forecast to exceed
million, as we continue to enhance our system’s safety and reliability.
We are investing in ways to improve our customers’ experience when doing business
with us by launching new self-service tools, such as a new website, optimized for both
desktop and mobile devices, and an enhanced automated phone system. We will also
provide call center agents with enabling technologies that maximize their performance,
even in the face of more complex interactions.
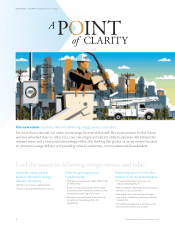
Our ongoing eorts to provide our customers with the best possible service were
validated by placing second among the largest South Region utilities, and a top-
quartilefinish among Midwest utilities, in the J.D. Power and Associates Gas
Utility Residential Customer Satisfaction Study.
SM
NATURAL GAS DISTRIBUTION
Pipeline Safety and Integrity
In the past years, we have replaced
percent of miles of cast iron pipe and
percent of the , miles of bare steel
pipe.In , we plan to invest more than
million in system safety and integrity.
Energy-Eciency Programs
By oering rebates to both residential and
business customers, our conservation
improvement programs in Arkansas,
Minnesota and Oklahoma encourage the
purchase of energy-ecient equipment.
In, the programs saved approximately
. billion cubic feet of natural gas, the
amount used annually by more than ,
homes. These programs also reduced total
carbon footprint by , metric tons, or
enough to remove , cars from roads for
one year.
Compressed Natural Gas
FuelingStations
We support the growth of compressed
natural gas as a vehicle fuel. In addition to
CNG fueling stations for our own vehicles,
we are providing fuel at public and other
private stations. Natural gas vehicles have
been shown to achieve dramatically lower
levels of carbon emissions compared with
those using gasoline.
Community Partnership Grants
In , our Community Partnership Grant
Program surpassed million in donations,
funding safety-related equipment and
projects. Over the previous decade,
theprogram has funded more than
projects for local first responders
andemergency personnel.
Meter Reading Technology
Our advanced meter reading technology
allows for accurate data collection, enhances
customer satisfaction by eliminating the
need to enter yards and improves
productivity by allowing a single employee
ina vehicle to read up to , meters
perday.
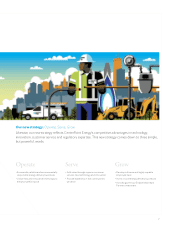
Technology-Driven Initiatives
We will use technology to give customers
more choices and personalized services.
Solutions will include a new website,
automated phone system and enhanced
tools for call center agents, all designed to
give customers the best possible experience
each time they interact with us.
POINT OF EFFICIENCY
1
2
3
4
5
6