Cathay Pacific 2005 Annual Report Download - page 9
Download and view the complete annual report
Please find page 9 of the 2005 Cathay Pacific annual report below. You can navigate through the pages in the report by either clicking on the pages listed below, or by using the keyword search tool below to find specific information within the annual report.-
 1
1 -
 2
2 -
 3
3 -
 4
4 -
 5
5 -
 6
6 -
 7
7 -
 8
8 -
 9
9 -
 10
10 -
 11
11 -
 12
12 -
 13
13 -
 14
14 -
 15
15 -
 16
16 -
 17
17 -
 18
18 -
 19
19 -
 20
20 -
21
-
22
-
23
-
24
-
25
-
26
-
27
-
28
-
29
-
30
-
31
-
32
-
33
-
34
-
35
-
36
-
37
-
38
-
39
-
40
-
41
-
42
-
43
-
44
-
45
-
46
-
47
-
48
-
49
-
50
-
51
-
52
-
53
-
54
-
55
-
56
-
57
-
58
-
59
-
60
-
61
-
62
-
63
-
64
-
65
-
66
-
67
-
68
-
69
-
70
-
71
-
72
-
73
-
74
-
75
-
76
-
77
-
78
-
79
-
80
-
81
-
82
-
83
-
84
-
85
-
86
-
87
-
88
-
89
-
90
-
91
-
92
-
93
-
94
-
95
-
96
 |
 |

7
Cathay Pacific Airways Limited Annual Report 2005
2001 2002 2003 2004 2005
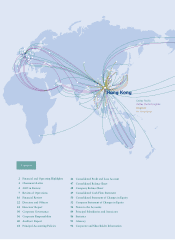
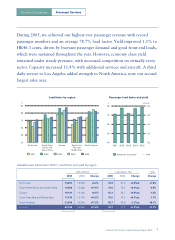
Load factor by region
North Asia South West
Pacific and
South Africa
Europe South East
Asia and
Middle East
North America
%
40
50
60
70
80
90
Passenger load factor Yield
Passenger load factor and yield
% HK cents
2001 2002 2003 2004 2005
40
50
60
70
80
20
30
40
50
60
%
Review of Operations
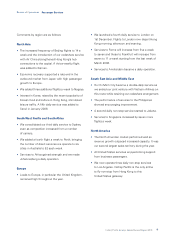
During 2005, we achieved our highest ever passenger revenue with record
passenger numbers and an average 78.7% load factor. Yield improved 1.1% to
HK46.3 cents, driven by buoyant passenger demand and good front-end loads,
which were sustained throughout the year. However, economy class yield
remained under steady pressure, with increased competition on virtually every
sector. Capacity increased 11.8% with additional services and aircraft. A third
daily service to Los Angeles added strength to North America, now our second
largest sales area.
Passenger Services
Available seat kilometres (”ASK”), load factor and yield by region:
ASK (million) Load factor (%) Yield
2005 2004 Change 2005 2004 Change Change
North Asia 13,057 12,290 +6.2% 70.8 67.2 +3.6%pt +1.8%
South West Pacific and South Africa 14,656 12,466 +17.6% 74.6 72.2 +2.4%pt -3.6%
Europe 16,181 15,194 +6.5% 87.3 83.7 +3.6%pt -1.2%
South East Asia and Middle East 17,376 15,764 +10.2% 75.0 74.3 +0.7%pt -1.1%
North America 21,496 18,348 +17.2% 82.7 84.9 -2.2%pt +8.1%
Overall 82,766 74,062 +11.8% 78.7 77.3 +1.4%pt +1.1%