Carphone Warehouse 2004 Annual Report Download - page 9
Download and view the complete annual report
Please find page 9 of the 2004 Carphone Warehouse annual report below. You can navigate through the pages in the report by either clicking on the pages listed below, or by using the keyword search tool below to find specific information within the annual report.-
 1
1 -
 2
2 -
 3
3 -
 4
4 -
 5
5 -
 6
6 -
 7
7 -
 8
8 -
 9
9 -
 10
10 -
 11
11 -
 12
12 -
 13
13 -
 14
14 -
 15
15 -
 16
16 -
 17
17 -
 18
18 -
 19
19 -
 20
20 -
21
-
22
-
23
-
24
-
25
-
26
-
27
-
28
-
29
-
30
-
31
-
32
-
33
-
34
-
35
-
36
-
37
-
38
-
39
-
40
-
41
-
42
-
43
-
44
-
45
-
46
-
47
-
48
-
49
-
50
-
51
-
52
 |
 |

The Carphone Warehouse Group PLC Annual Report 2004
7
Growing our store portfolio remains a central element
of our Group strategy and we expect to accelerate our
store opening programme in the coming year, with 200
new stores planned. This will enable us to grow market
share and to continue to improve our competitive position
in all of our markets. With the sale of the Czech business
to management shortly before the year end, we are now
focused on ten markets, which will form the platform
for future growth in Retail and other business streams.
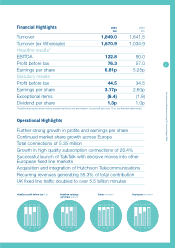
Total Retail revenues grew by 28.2% and gross profit by
20.4%. Like-for-like, after stripping out the impact of new
store openings, revenues grew by 21.0% and gross profit
by 14.2%. The increase in revenues was for the most part
driven through the strong connections growth through the
year, but average revenues per connection also grew by
4.3% as customers tended to trade up to higher value
handsets as network subsidies made them more affordable.
As expected, average cash gross profit per connection
fell by 2.0% from £57.1 to £56.0. Although we benefited
in part from an improvement in the business mix, average
gross profit on subscription connections fell by 3.3%, as
anticipated, as a greater proportion of customers sought
to upgrade on their existing network rather than switch
network. We make a lower gross profit on upgrades than
on new subscriptions.
The Retail business remains focused on generating a target
cash gross profit on subscription and pre-pay connections
rather than on a target gross margin. In this way we believe
we will maximise growth in profits from our Retail business
by achieving the right balance between volume and value.
Hence, when revenues per connection rise, the deterioration
in our gross margin is exaggerated, but the converse will be
true in an environment of falling revenues per connection.
Contribution (see note 10 to the financial statements) from
Retail grew by 23.5% to £83.0m. The contribution margin
fell from 9.1% to 8.8%. However, the ratio between
contribution and gross profit, which gives a more
meaningful indication of cost efficiency given the variability
of revenues per connection, improved from 28.7% to
29.4%. Overall Retail direct costs grew by 19.2%, driven by
the greater store base, a significant number of rent reviews,
and higher levels of commission payments to our sales
consultants in the strong market environment.
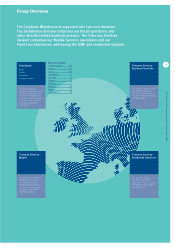
The Distribution division comprises our Retail operations
and all directly-related business streams.
Divisional performance
Distribution revenues grew by 28.9% in the year to
£1,128.9m, and the division generated EBIT of £66.9m,
a rise of 52.0% on the prior year. Growth was consistently
strong across all business units within Distribution.
Retail and Online
The Group achieved 5.35m connections during the year,
representing year-on-year growth of 22.6%. Within these
figures, 0.31m connections were made through our Online
channels (inbound call centre, interactive TV and website).
We estimate that the Western European handset market
grew by 18% in the year to March 2004, so once again the
Group achieved meaningful market share gains during the
period, particularly in the high value subscription market.
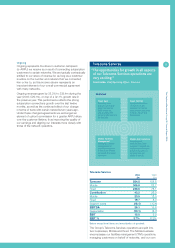
Connections (000s)
2004 2003
Subscription 2,413 1,909
Pre-pay 2,520 1,972
SIM-free 417 483
Total 5,350 4,364
Of which Online 307 261
In the key metric of subscription connections, we achieved
growth of 26.4% to 2.41m, with the rate of growth
accelerating throughout the year. In the fourth quarter,
subscription growth was 32.4%. Our subscription mix
improved by 1.4 percentage points to 45.1%. This strong
performance was driven by increasing network competition
for high value customers, an exciting range of new handsets
from manufacturers, and our own reputation for providing
the widest choice and impartial advice to customers.
Growth in pre-pay connections was also robust, particularly
over the Christmas period and into the fourth quarter of
our financial year. Retail prices came down to levels not
seen for three or four years because of the wide availability
of cheap entry-level handsets from manufacturers and
a renewed focus from network operators. As a result
we witnessed high levels of replacement in the market.
As a direct consequence of these lower pre-pay prices,
our SIM-free handset sales fell during the year. From a
financial perspective there is no material difference to the
Group between a pre-pay connection and a SIM-free sale.
We opened 158 new stores during the year and closed
or sold 84. The total number of stores increased from
1,140 at March 2003 to 1,214 by March 2004. The total
includes 26 franchise stores (March 2003: 11 franchises).
Total average selling space increased by 4.6% to 66,170
sqm (2003: 63,233 sqm) and sales per square metre
increased by 22.5% to £14,303 (2003: £11,676).
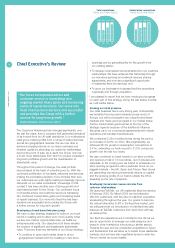
In the key metric of subscription
connections, we achieved growth
of 26.4% to 2.41m, with the rate
of growth accelerating throughout the
year. In the fourth quarter, subscription
growth was 32.4%.
22.9 32.2 48.0 76.8
03 040201
Contribution from
non-UK operations (£m)
795 939 1,060
030201
1,324
04
Insurance base (000s)