Cardinal Health 2015 Annual Report Download - page 12
Download and view the complete annual report
Please find page 12 of the 2015 Cardinal Health annual report below. You can navigate through the pages in the report by either clicking on the pages listed below, or by using the keyword search tool below to find specific information within the annual report.-
 1
1 -
 2
2 -
 3
3 -
 4
4 -
 5
5 -
 6
6 -
 7
7 -
 8
8 -
 9
9 -
 10
10 -
 11
11 -
 12
12 -
 13
13 -
 14
14 -
 15
15 -
 16
16 -
 17
17 -
 18
18 -
 19
19 -
 20
20 -
 21
21 -
 22
22 -
23
-
24
-
25
-
26
-
27
-
28
-
29
-
30
-
31
-
32
-
33
-
34
-
35
-
36
-
37
-
38
-
39
-
40
-
41
-
42
-
43
-
44
-
45
-
46
-
47
-
48
-
49
-
50
-
51
-
52
-
53
-
54
-
55
-
56
-
57
-
58
-
59
-
60
-
61
-
62
-
63
-
64
-
65
-
66
-
67
-
68
-
69
-
70
-
71
-
72
-
73
-
74
-
75
-
76
-
77
-
78
-
79
-
80
-
81
-
82
-
83
-
84
-
85
-
86
-
87
-
88
-
89
-
90
-
91
 |
 |

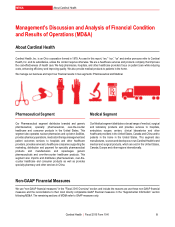
MD&A Results of Operations
11 Cardinal Health | Fiscal 2015 Form 10-K
Results of Operations
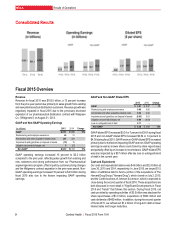
Revenue
Revenue Change
(in millions) 2015 2014 2013 2015 2014
Pharmaceutical $91,116 $80,110 $91,097 14% (12)%
Medical 11,395 10,962 10,060 4% 9 %
Total segment revenue 102,511 91,072 101,157 13% (10)%
Corporate 20 12 (64) N.M. N.M.
Total revenue $102,531 $91,084 $101,093 13% (10)%
Fiscal 2015 Compared to Fiscal 2014
Pharmaceutical Segment
Revenue growth for fiscal 2015 compared to fiscal 2014 was primarily
due to sales growth from existing and new pharmaceutical distribution
customers, which increased revenue by $13.7 billion during fiscal
2015. The growth was primarily driven by increased sales to existing
customers, including continued branded pharmaceutical price
inflation and newly launched hepatitis C pharmaceutical products.
The increase was partially offset by the Walgreens contract expiration
in the prior-year period ($3.3 billion).
Medical Segment
Revenue growth for fiscal 2015 compared to fiscal 2014 was primarily
due to acquisitions ($344 million).
Fiscal 2014 Compared to Fiscal 2013
Pharmaceutical Segment
Revenue for fiscal 2014 compared to fiscal 2013 was negatively
impacted by the Walgreens contract expiration ($16.9 billion) and by
the expiration of our pharmaceutical distribution contract with Express
Scripts, Inc. ("Express Scripts") on September 30, 2012 ($2.0 billion).
This decrease was partially offset by sales growth from existing
pharmaceutical distribution customers ($7.1 billion).
Medical Segment
Revenue growth for fiscal 2014 compared to fiscal 2013 was primarily
due to acquisitions ($816 million).
Cost of Products Sold
As a result of the same factors affecting the change in revenue, consolidated cost of products sold increased $10.9 billion (13 percent) and
decreased $10.2 billion (11 percent) during fiscal 2015 and 2014, respectively. See the gross margin discussion for additional drivers impacting
cost of products sold.