Cardinal Health 2012 Annual Report Download - page 17
Download and view the complete annual report
Please find page 17 of the 2012 Cardinal Health annual report below. You can navigate through the pages in the report by either clicking on the pages listed below, or by using the keyword search tool below to find specific information within the annual report.-
 1
1 -
2
-
3
-
4
-
5
-
6
-
 7
7 -
 8
8 -
 9
9 -
 10
10 -
 11
11 -
 12
12 -
 13
13 -
 14
14 -
 15
15 -
 16
16 -
 17
17 -
 18
18 -
 19
19 -
 20
20 -
 21
21 -
 22
22 -
 23
23 -
 24
24 -
 25
25 -
 26
26 -
 27
27 -
28
-
29
-
30
-
31
-
32
-
33
-
34
-
35
-
36
-
37
-
38
-
39
-
40
-
41
-
42
-
43
-
44
-
45
-
46
-
47
-
48
-
49
-
50
-
51
 |
 |

Cardinal Health, Inc. and Subsidiaries
Management's Discussion and Analysis of Financial Condition and Results of Operations
15
The discussion and analysis presented below refers to, and should be
read in conjunction with, the consolidated financial statements and related
notes included in this annual report. Unless otherwise indicated,
throughout this Management’s Discussion and Analysis of Financial
Condition and Results of Operations, we are referring to our continuing
operations.
Overview
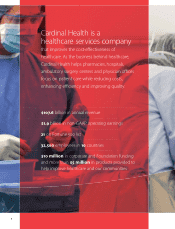
We are a healthcare services company providing pharmaceutical and
medical products and services that help pharmacies, hospitals, surgery
centers, physician offices and other healthcare providers focus on patient
care while reducing costs, enhancing efficiency and improving quality. We
report our financial results in two segments: Pharmaceutical and Medical.
During fiscal 2012, we achieved revenue of $107.6 billion and increased
our operating earnings by 18 percent to $1.8 billion. Our growth in revenue
was due to increased volume from existing customers ($2.4 billion) and
acquisitions ($2.4 billion). The increase in operating earnings reflects
strong performance in our Pharmaceutical segment generic programs,
the positive impact of acquisitions, and a $71 million gain realized upon
adjusting the contingent consideration obligation associated with the P4
Healthcare acquisition. Earnings from continuing operations were up 11
percent for the twelve months ended June 30, 2012 due to the factors
discussed above.
Our cash and equivalents balance was $2.3 billion as of June 30, 2012,
compared to $1.9 billion as of June 30, 2011. The increase in cash and
equivalents was primarily attributable to net cash provided by operating
activities of $1.2 billion, partially offset by share repurchases of $450 million
and cash dividends of $300 million. We plan to continue to execute a
balanced deployment of available capital to position ourselves for
sustainable competitive advantage and to enhance shareholder value.
Trends
Within our Pharmaceutical segment, we expect revenue to decrease in
fiscal 2013. The factors contributing to this decrease include reduced
revenue as a result of branded-to-generic pharmaceutical conversions
and the expiration on September 30, 2012 of our pharmaceutical
distribution contract with Express Scripts, Inc. Branded-to-generic
pharmaceutical conversions impact our revenues because generic
pharmaceuticals generally sell at a lower price than the corresponding
branded product and because some of our customers source generic
products directly from manufacturers rather than purchasing from us. Our
contract with Express Scripts, Inc. was not renewed in connection with
the combined pharmaceutical distribution contract that was not awarded
to us following that company's merger with Medco Health Solutions, Inc.
We recognized approximately $9.0 billion of revenue from sales to Express
Scripts, Inc. in fiscal 2012, all of which was classified as bulk sales.
In our Pharmaceutical segment, we also anticipate fewer significant new
generic pharmaceutical product launches in fiscal 2013. However, the
impact of these launches on our gross margin can vary depending on the
timing, size and number of entrants.
Within our Medical segment, variability in the cost of commodities such
as oil-based resins, cotton, latex, diesel fuel and other commodities can
have a significant impact on the cost of products sold. Although commodity
prices fluctuate, we do not expect changes in commodity prices to have
a significant impact on our year-over-year results of operations in fiscal
2013.
The Patient Protection and Affordable Care Act includes a tax to be paid
by medical device manufacturers equal to 2.3 percent of the price for which
manufacturers sell their products, which is scheduled to begin January 1,
2013. We manufacture and sell devices that, based on the currently
proposed rules, will be subject to this tax. There have been proposals to
repeal this tax and modify the proposed rules, which if adopted, may
reduce the impact of this tax on us.
Acquisitions
We have completed several acquisitions since July 1, 2009, the largest
of which were Kinray, Inc. ("Kinray"), Healthcare Solutions Holding, LLC
("P4 Healthcare") and Cardinal Health China, each of which was
completed in fiscal 2011. In this Management's Discussion and Analysis,
we identify the contribution of an acquisition until the one-year anniversary
of the acquisition. Using this definition, for fiscal 2012 and 2011,
acquisitions contributed revenues of $2.4 billion and $2.9 billion,
respectively, and operating earnings of $79 million and $61 million,
respectively.
See Note 2 of the “Notes to Consolidated Financial Statements” for more
information on acquisitions.
Spin-Off of CareFusion
Effective August 31, 2009, we separated our clinical and medical products
business through the distribution to our shareholders of 81 percent of the
then outstanding common stock of CareFusion and retained the remaining
41 million shares of CareFusion common stock. During fiscal 2011 and
2010, we disposed of 30 million and 11 million shares of CareFusion
common stock, respectively.
We entered into a separation agreement with CareFusion on July 22, 2009
to effect the Spin-Off and provide a framework for our relationship with
CareFusion after the Spin-Off. In addition, on August 31, 2009, we entered
into a transition services agreement, a tax matters agreement and an
accounts receivable factoring agreement with CareFusion, among other
agreements.
Under the transition services agreement, during fiscal 2012, 2011 and
2010, we recognized $3 million, $65 million and $99 million, respectively,
in transition service fee income.
Under the tax matters agreement, CareFusion is obligated to indemnify
us for certain tax exposures and transaction taxes prior to the Spin-Off. The
indemnification receivable was $265 million and $264 million at June 30,
2012 and 2011, respectively, and is included in other long-term assets in
the consolidated balance sheets.
Under the accounts receivable factoring agreement, during fiscal 2011
and 2010, we purchased $460 million and $606 million of CareFusion
trade receivables, respectively. The accounts receivable factoring
arrangement expired on April 1, 2011.
Results of Operations
Revenue
Change Revenue
(in millions) 2012 2011 2012 2011 2010
Pharmaceutical 4% 4% $ 97,925 $ 93,744 $ 89,790
Medical 8% 2% 9,642 8,922 8,750
Total Segment 5% 4% $ 107,567 $ 102,666 $ 98,540
Corporate N.M. N.M. (15) (22) (37)
Consolidated 5% 4% $ 107,552 $ 102,644 $ 98,503